
Max Ghenis
Bio
Participation2
I'm the co-founder and CEO of PolicyEngine, a tech nonprofit that computes the impacts of public policy (policyengine.org). I'm also the founder and president of the UBI Center, a think tank researching universal basic income policies (ubicenter.org).
I first got into EA in 2012: I worked at Google at the time, and Google.org made a grant to GiveDirectly. I've since taken the GWWC pledge and focused my giving on GiveDirectly and GiveWell. I was active in Google's EA group and also MIT's when I went there for grad school in 2020.
I'm also the founder of Ventura County YIMBY, and a volunteer California state coordinator for Citizens' Climate Lobby, a grassroots organization advocating for a national carbon fee-and-dividend policy.
Posts 1
Comments48
Topic contributions1
Are there plans to support OWID's explorer charts? For example this one doesn't render:
https://ourworldindata.org/explorers/poverty-explorer?tab=chart&time=latest&facet=none&country=USA~AUS~AUT~BEL~CAN~CHL~COL~CRI~CZE~DNK~EST~FIN~FRA~DEU~GRC~HUN~ISL~IRL~ISR~ITA~JPN~LVA~LTU~LUX~MEX~NLD~NOR~POL~PRT~SVK~KOR~SVN~SWE~CHE~ESP~TUR~GBR~OWID_WRL&Indicator=Income+or+consumption+of+the+poorest+10%25&Poverty+line=%242.15+per+day%3A+International+Poverty+Line&Household+survey+data+type=Show+data+from+both+income+and+consumption+surveys&Show+breaks+between+less+comparable+surveys=false
Screenshot:
Yeah both my cofounder Nikhil and I are longtime EAs :) We have a couple projects in the works on tying PolicyEngine to EA , which we'll probably launch in the next couple months.
Nikhil is actually in the UK as well (I'm in DC), so could you please connect him to the EAGx Cambridge folks? He's nikhil@policyengine.org.
You can also use PolicyEngine UK (my nonprofit's free, open source web app) to estimate your taxes and benefits given your income and household characteristics. It captures nuances like the Child Benefit High Income Tax Charge and phase-outs of Universal Credit and the Personal Allowance, and shows your total marginal tax rate considering these factors.
You can also design custom policy reforms, and PolicyEngine estimates the impact, both on the UK and your own household.
I'm all for this, though I've got a dog in the fight: I'm ED of PolicyEngine, a nonprofit that largely intends to improve epistemics around economic policymaking by making epistemic tech available to everyone. Our free, open source software estimates households' taxes and benefit eligibility, and lets users design customizable policy reforms and estimate impacts on society and households.
Since you mentioned a carbon tax, our new app beta.policyengine.org, which we'll launch in January, lets you design a custom carbon tax in the UK. Here's a 2-minute video on how to do that and pair the carbon tax with a dividend, or the link directly to the policy. For example, we estimate that a budget neutral £100/ton carbon dividend would benefit 2/3 of UK residents and lower the poverty rate by 7%. We also model much of the US tax-benefit system, though we currently only model carbon taxes in the UK (here's how).
We'd be excited about building PolicyEngine into an educational initiative, especially with EAs. We've also started working on an EA Forum post for a shallow dive cost-effectiveness of computational policy simulation--I think this plays well into our community's embrace of forecasting as well. Happy to chat more with folks on this.
How many consumption-doublings does a policy reform generate?
GiveDirectly's unconditional cash transfers have long served as GiveWell's cost-effectiveness baseline. GiveWell's 2022 cost-effectiveness analysis estimates that GiveDirectly doubles the consumption of a person for a year for about $200. [1]
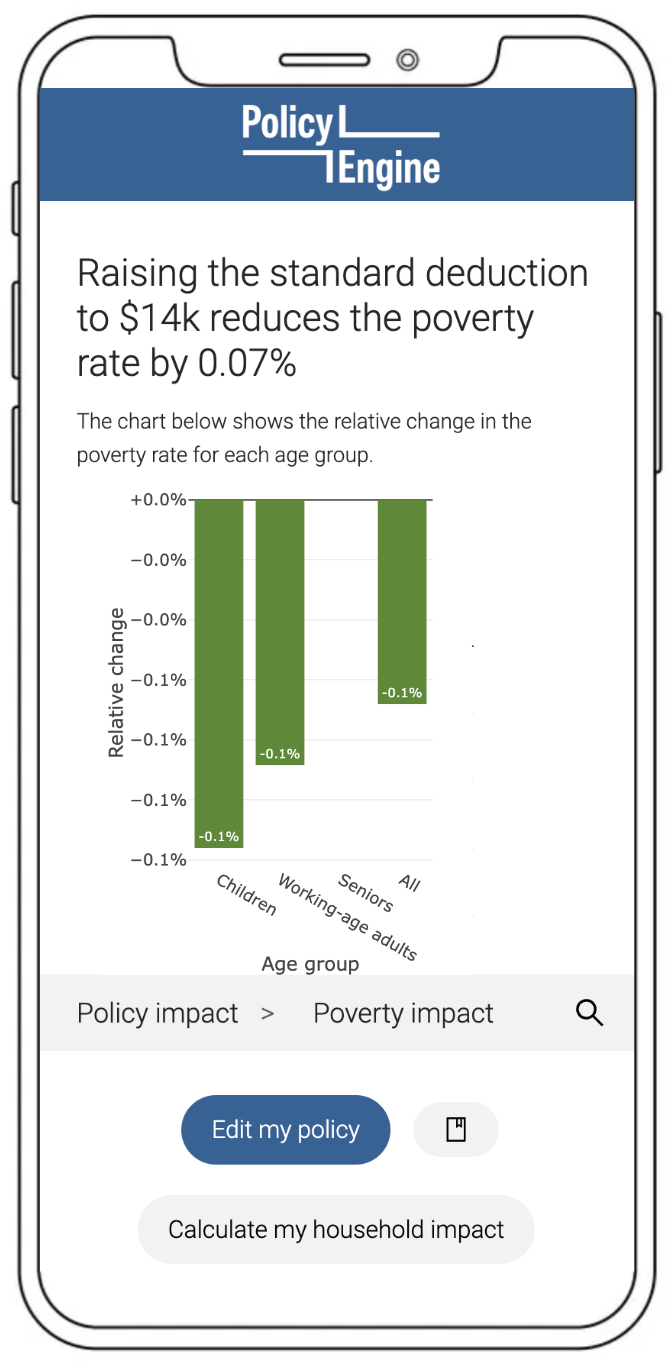
Tax and benefit reforms also affect households' consumption. My nonprofit, PolicyEngine, builds free open-source software that computes the impact of custom tax and benefit reforms on outcomes like poverty and the budget. This slide from my EAGxBerkeley lightning talk shows how we will display poverty impacts of a custom tax reform in our upcoming redesign.
My proposal is to add a chart to our app showing the impact of a policy reform on sum(ln(net income)), which could translate to total consumption-doublings for comparison with GiveDirectly. This could enable more data-driven EA-style advocacy for poverty-reducing policies. Currently we have models in the US and the UK, but we intend to expand to low- and middle-income countries in the future, and this visualization would translate to those new country models where reforms might be more cost-effective.
Here's our GitHub. Our stack is Python/Flask/React.
- ^
Cell B87 shows that each philanthropic dollar spent generates
0.0034units of value, which in this case is one-unit increases ofln(consumption). That is, it costs1/0.0034=$294to increase a person'sln(consumption)by one unit for a year. Doubling consumption for a year therefore costs$294 * ln(2) = $204.
My colleague Ahmed Ahmed and I summarized research on fertility in the context of the US Child Tax Credit expansion in this UBI Center report last year. We cited the Lyman Stone article from here:
Stone’s research suggests that making it permanent could close between 15% and 65% of the gap to a replacement fertility rate.
My nonprofit PolicyEngine has also been scoping how to predict fertility impacts in our app that computes the impact of custom tax and benefit reforms. Our shallow dive hasn't turned up standard elasticities with respect to current-year policy changes though, so while we could create ones like % change to births with respect to % change to net income of parents of newborns, I don't know how well this would connect well to the literature.
In general, though, Stone finds that baby bonuses are most cost-effective at spurring births. Other evidence suggests that reducing infant poverty improves developmental outcomes more cost-effectively than interventions later in life, and baby bonuses could be easily administered at any level of government (just run payments through the hospitals). In my view, that all makes baby bonuses an underexplored plausibly cost-effective intervention, both from a lobbying/policy perspective and through philanthropic means (a la GiveDirectly).
Really interesting post. Not to hijack it, but I didn't know about the EA Forecasting & Epistemics Slack. Can you point me to info on it or how to join?
Web app implementing giving pledges based on net income (after taxes and benefits)
The Giving What We Can Pledge is 10% of pre-tax income, if giving is tax-deductible, or 10% of post-tax income otherwise. We've scoped a different pledge, in which one gives the amount such that their net income after taxes and benefits falls 10%. You can also think of this as transferring 10% of your consumption to effective charity.
We propose building a web app where people enter their household information and it suggests the amount to give. The app would call the free, open source PolicyEngine API to compute taxes and benefits (I am the Executive Director of PolicyEngine, a nonprofit). I think in a day we can build a simple US prototype that collects a handful of data points (earnings, family size, state) and displays the computation.
I've discussed this idea with Luke Freeman, Executive Director of Giving What We Can, who supported experimenting with it.
We could cultivate for-profit entrepreneurship in fields with clearer social benefit. I've seen arguments that people can make a bigger impact by focusing on social impact or profitability rather than trying to do both, and I think that's true on the margin for most people, but embracing crypto may have overcorrected.
Hi, thanks for sharing this. I've long supported GiveDirectly's global programs, and agree that your work can help inform better policy in high-income countries as well. While I don't think direct transfers to Americans would come close to the GiveWell bar, I'd be interested in cost-effectiveness analyses of advocacy for policy reform. Some of the other comments on this post could also be useful for constructing such a BOTEC, and so I wanted to add some clarifications as well:
The linked study, titled "Novel Estimates of Mortality Associated With Poverty in the US," does not make a causal claim like this. Here's what it says:
The causal effect is likely smaller. Furthermore, the study defines poverty as income below half the median income in each year, meaning it's not assessing the association between absolute living standards and mortality.
Like the above study, the OECD defines poverty as income below half the median. So this is really a measure of inequality.
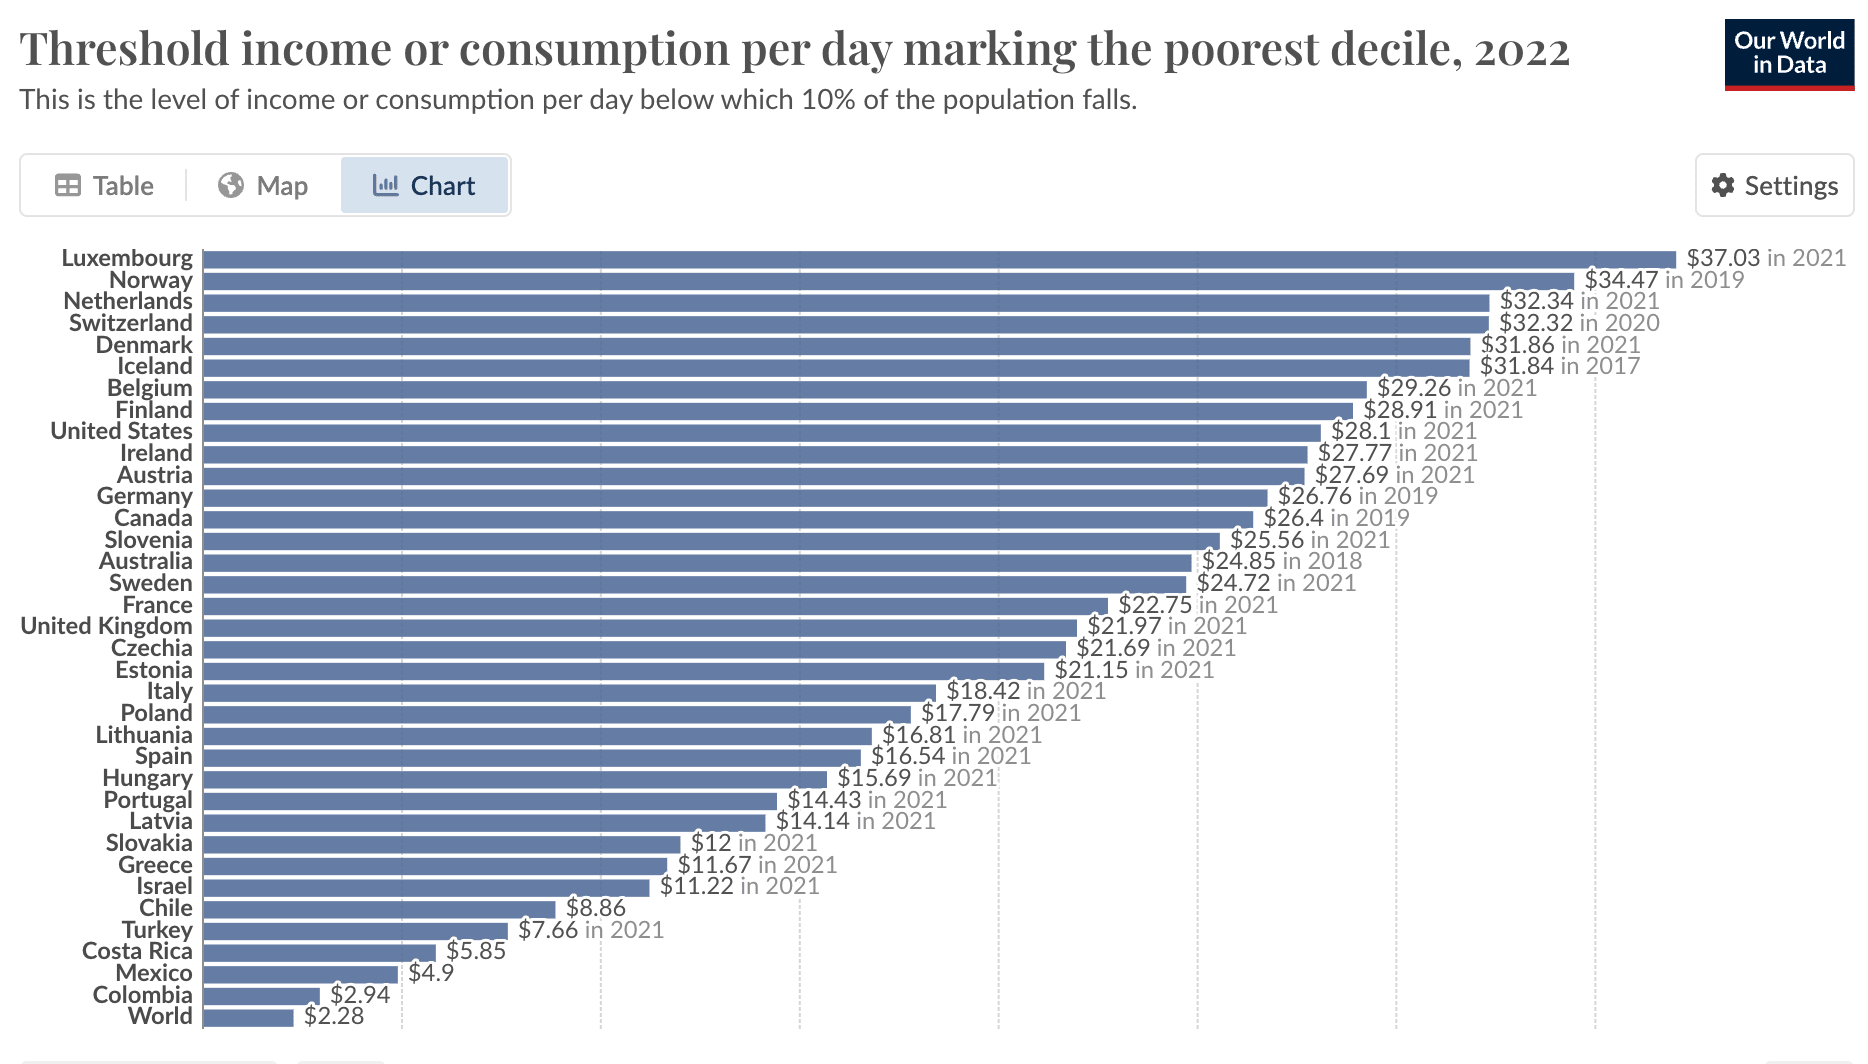
On a more absolute measure--the threshold of income marking the poorest decile, after taxes and benefits--the US ranks 9 of 35 OECD countries evaluated:
My understanding is that the vast majority of that 22.7% of GDP is Social Security and Medicare. It also ignores the effect of taxes, and non-refundable credits like the bulk of the US Child Tax Credit, both of which can significantly affect low-income people (European countries rely more on consumption taxes, for instance).
Another way of assessing this is how much a country's inequality changes before and after taxes and transfers. Here the OECD ranks the US 31st of 37th in inequality reduction through redistribution.
This result mostly extends a long, steady trend of improvement.
A few things here:
Again, I greatly appreciate the work you all do, and agree that US antipoverty advocacy is at least understudied in EA. As one example, the Baltimore Baby Bonus ballot measure campaign seems plausibly cost-effective, given the enormous returns to reducing infant poverty (as also motivates RxKids), and their lean, scalable operation. My nonprofit, PolicyEngine, provides free open-source software for analyzing antipoverty policies, and we'd be glad to help in any endeavor to study the impact of reforms. I hope my comments can expedite some work for an enterprising EA to dig further into this important area.