This is the summary of the report with additional images (and some new text to explain them) The full 90+ page report (and a link to its 80+ page appendix) is on our website.
Summary
This report forms part of our work to conduct cost-effectiveness analyses of interventions and charities based on their effect on subjective wellbeing, measured in terms of wellbeing-adjusted life years (WELLBYs). This is a working report that will be updated over time, so our results may change. This report aims to achieve six goals, listed below:
1. Update our original meta-analysis of psychotherapy in low- and middle-income countries.
In our updated meta-analysis we performed a systematic search, screening and sorting through 9390 potential studies. At the end of this process, we included 74 randomised control trials (the previous analysis had 39). We find that psychotherapy improves the recipient’s wellbeing by 0.7 standard deviations (SDs), which decays over 3.4 years, and leads to a benefit of 2.69 (95% CI: 1.54, 6.45) WELLBYs. This is lower than our previous estimate of 3.45 WELLBYs (McGuire & Plant, 2021b) primarily because we added a novel adjustment factor of 0.64 (a discount of 36%) to account for publication bias.
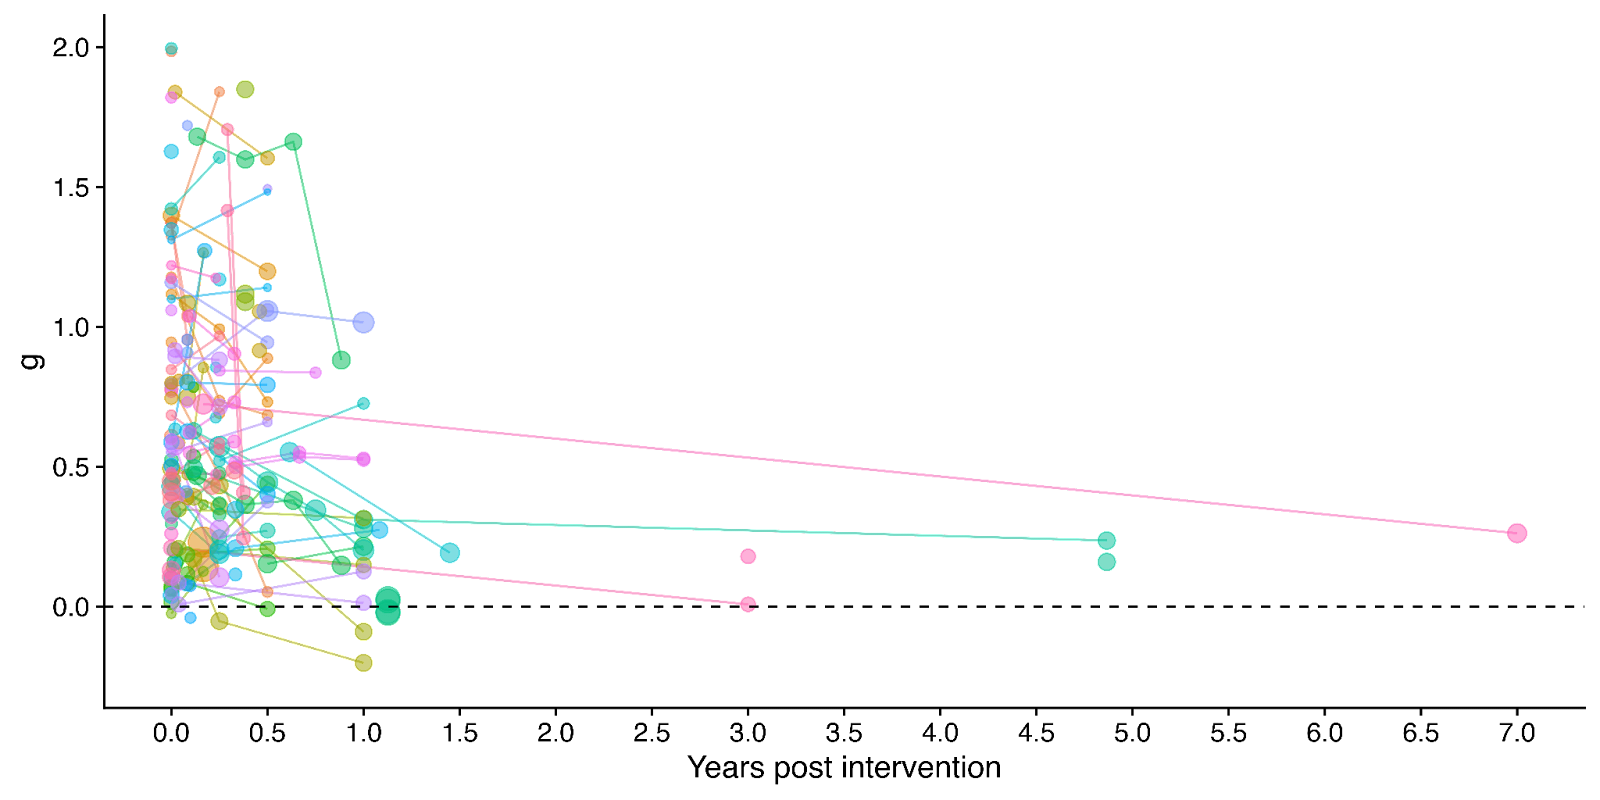
Figure 1: Distribution of the effects for the studies in the meta-analysis, measured in standard deviations change (Hedges’ g) and plotted over time of measurement. The size of the dots represents the sample size of the study. The lines connecting dots indicate follow-up measurements of specific outcomes over time within a study. The average effect is measured 0.37 years after the intervention ends. We discuss the challenges related to integrating unusually long follow-ups in Sections 4.2 and 12 in the report.
2. Update our original estimate of the household spillover effects of psychotherapy.
We collected 5 (previously 2) RCTs to inform our estimate of household spillover effects. We now estimate that the average household member of a psychotherapy recipient benefits 16% as much as the direct recipient (previously 38%). See McGuire et al. (2022b) for our previous report-length treatment of household spillovers.
3. Update our original cost-effectiveness analysis of StrongMinds, an NGO that provides group interpersonal psychotherapy in Uganda and Zambia.
We estimate that a $1,000 donation results in 30 (95% CI: 15, 75) WELLBYs, a 52% reduction from our previous estimate of 62 (see our changelog website page). The cost per person treated for StrongMinds has declined to $63 (previously $170). However, the estimated effect of StrongMinds has also decreased because of smaller household spillovers, StrongMinds-specific characteristics and evidence which suggest smaller-than-average effects, and our inclusion of a discount for publication bias.
The only completed RCT of StrongMinds is the long anticipated study by Baird and co-authors, which has been reported to have found a “small” effect (another RCT is underway). However, this study is not published, so we are unable to include its results and unsure of its exact details and findings. Instead, we use a placeholder value to account for this anticipated small effect as our StrongMinds-specific evidence.[1]
4. Evaluate the cost-effectiveness of Friendship Bench, an NGO that provides individual problem solving therapy in Zimbabwe.
We find a promising but more tentative initial cost-effectiveness estimate for Friendship Bench of 58 (95% CI: 27, 151) WELLBYs per $1,000. Our analysis of Friendship Bench is more tentative because our evaluation of their programme and implementation has been more shallow. It has 3 published RCTs which we use to inform our estimate of the effects of Friendship Bench. We plan to evaluate Friendship Bench in more depth in 2024.
5. Update our charity evaluation methodology.
We improved our methodology for combining our meta-analysis of psychotherapy with charity-specific evidence. Our new method uses Bayesian updating, which provides a formal, statistical basis for combining evidence (previously we used subjective weights). Our rich meta-analytic dataset of psychotherapy trials in LMICs allowed us to predict the effect of charities based on characteristics of their programme such as expertise of the deliverer, whether the therapy was individual or group-based, and the number of sessions attended (previously we used a more rudimentary version of this). We also applied a downwards adjustment for a phenomenon where sample restrictions common to psychotherapy trials inflate effect sizes. We think the overall quality of evidence for psychotherapy is ‘moderate’.
6. Update our comparison to other charities
Finally, we compare StrongMinds and Friendship Bench to GiveDirectly cash transfers, which we estimated as 8 (95% CI: 1, 32) WELLBYs per $1,000 (McGuire et al., 2022b). We find here that StrongMinds is 30 (95% CI: 15, 75) WELLBYs per $1,000. Hence, comparing the point estimates, we now estimate that, in WELLBYs, StrongMinds is 3.7x (previously 8x) as cost-effective as GiveDirectly and Friendship Bench is 7.0x as cost-effective as GiveDirectly.
These estimates are largely determined by our estimates of household spillover effects, but the evidence on these effects is much weaker for psychotherapy than cash transfers. It is worth noting that if we only consider the effects on the direct recipient, this increases psychotherapy’s WELLBY effects relative to cash transfers - StrongMinds and Friendship Bench move to 10x and 21x as cost-effective as GiveDirectly, respectively. But it reduces the cost-effectiveness compared to antimalarial bednets. We also present and discuss (Section 12 in the report) how sensitive these results are to the different analytical choices we could have made in our analysis.
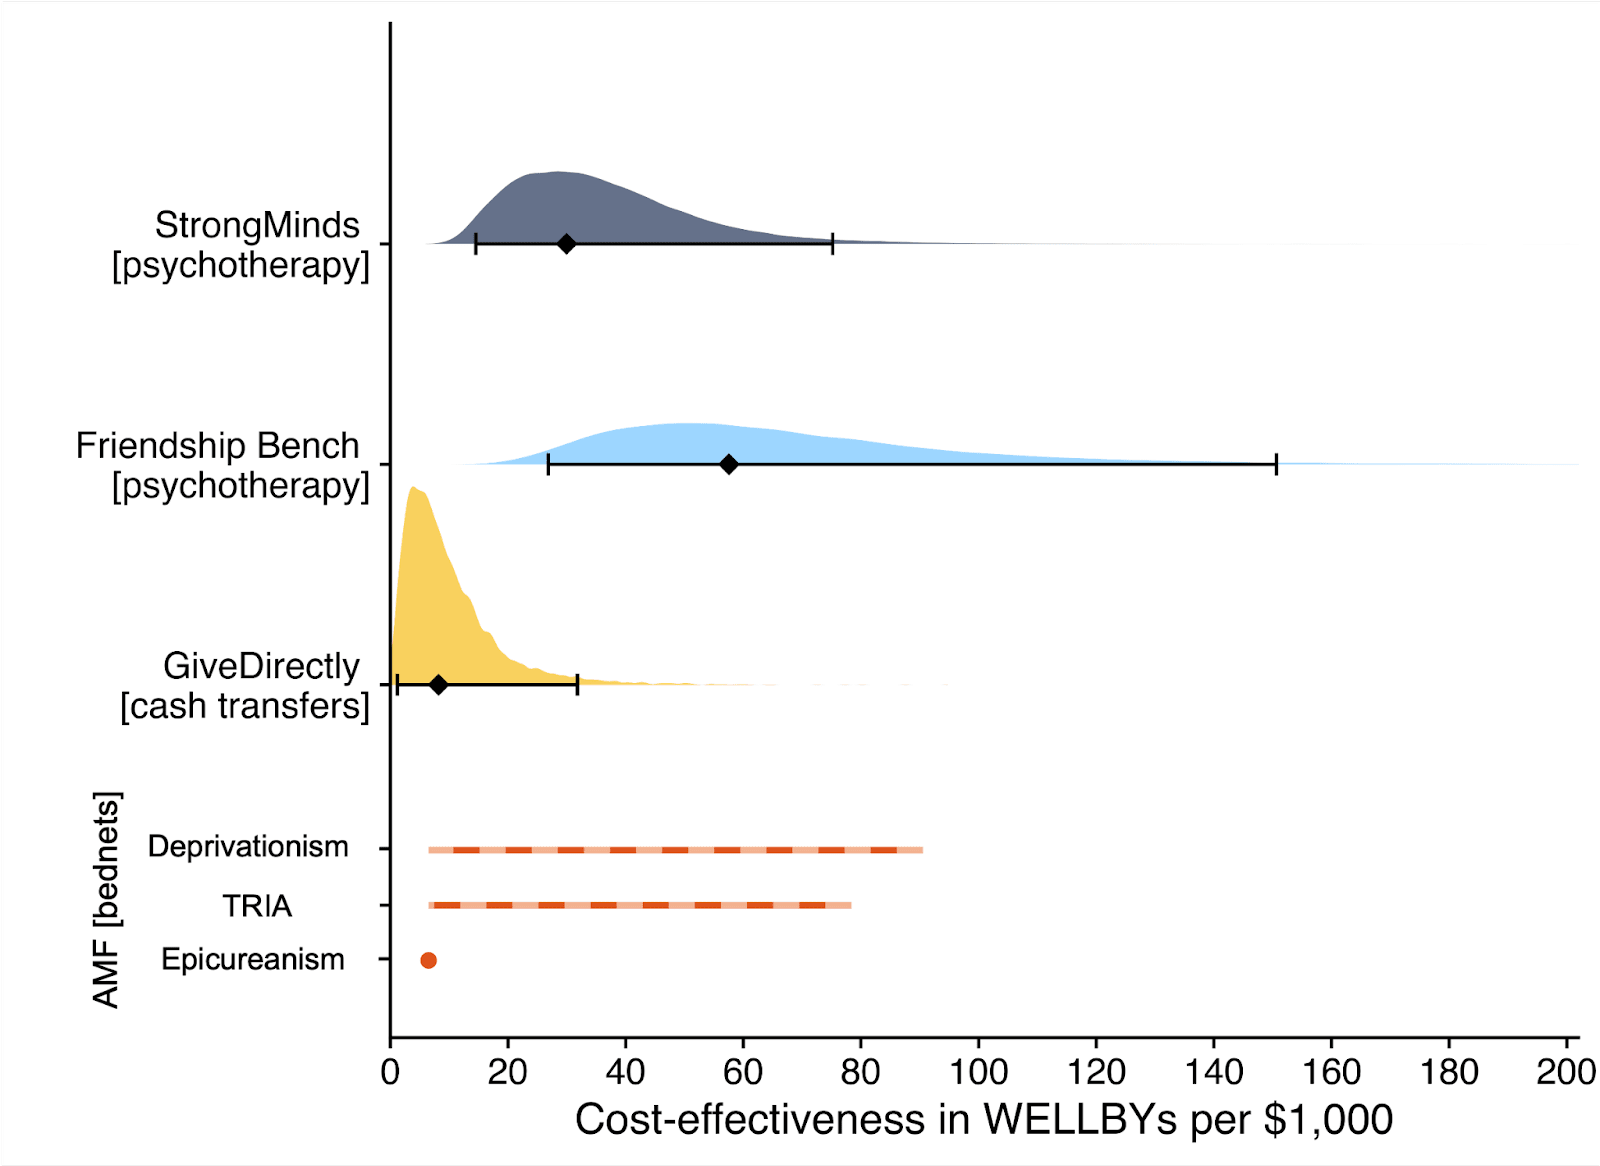
Figure 2: Comparison of charity cost-effectiveness. The diamonds represent the central estimate of cost-effectiveness (i.e., the point estimates). The shaded areas are probability density distribution and the solid whiskers represent the 95% confidence intervals for StrongMinds, Friendship Bench, and GiveDirectly. The lines for AMF (the Against Malaria Foundation) are different from the others[2]. Deworming charities are not shown, because we are very uncertain of their cost-effectiveness.
We think this is a moderate-to-in-depth analysis, where we have reviewed most of the available evidence and made many improvements to our methodology. We view the quality of evidence as ‘moderate to high’ for understanding the effect of psychotherapy on its direct recipients in general, ‘low’ for household spillovers, and ‘low to moderate’ for the charity-specific evidence for psychotherapy (StrongMinds and Friendship Bench). Therefore, we see the overall quality of evidence as ‘moderate’.
This is a working report, and results may change over time. We welcome feedback to improve future versions.
Notes
Author note: Joel McGuire, Samuel Dupret, and Ryan Dwyer contributed to the conceptualization, investigation, analysis, data curation, and writing of the project. Michael Plant contributed to the conceptualization, supervision, and writing of the project. Maxwell Klapow contributed to the systematic search and writing.
Reviewer note: We thank, in chronological order, the following reviewers: David Rhys Bernard (for trajectory over time), Ismail Guennouni (for multilevel methodology), Katy Moore (general), Barry Grimes (general), Lily Yu (charity costs), Peter Brietbart (general), Gregory Lewis (general), Ishaan Guptasarma (general), Lingyao Tong (meta-analysis methods and results), Lara Watson (communications).
Charity evaluation note: We thank Jess Brown, Andrew Fraker, and Elly Atuhumuza for providing information about StrongMinds and for their feedback about StrongMinds specific details. We also thank Lena Zamchiya and Ephraim Chiriseri for providing information about Friendship Bench.
Appendix note: This report will be accompanied by an online appendix that we reference for more detail about our methodology and results. The appendix is a working document and will, like this report, be updated over time.
Updates note: This is the first draft of a working paper. New versions will be uploaded over time.

- ^
We use a study that has similar features to the StrongMinds intervention and then discount its results by 95% in the expectation of the Baird et al. study finding a small effect. Note that we do not only rely on StrongMinds-specific evidence in our analysis but combine charity-specific evidence with the results from our general meta-analysis of psychotherapy in a Bayesian manner.
- ^
They represent the upper and lower bound of cost-effectiveness for different philosophical views (not 95% confidence intervals as we haven’t represented any statistical uncertainty for AMF). Think of them as representing moral uncertainty, rather than empirical uncertainty. The upper bound represents the assumptions most generous to extending lives (a low neutral point and age of connectedness) and the lower bound represents those most generous to improving lives (a high neutral point and age of connectedness). The assumptions depend on the neutral point and one’s philosophical view of the badness of death (see Plant et al., 2022, for more detail). These views are summarised as: Deprivationism (the badness of death consists of the wellbeing you would have had if you’d lived longer); Time-relative interest account (TRIA; the badness of death for the individual depends on how ‘connected’ they are to their possible future self. Under this view, lives saved at different ages are assigned different weights); Epicureanism (death is not bad for those who die – this has one value because the neutral point doesn’t affect it).
HLI kindly provided me with an earlier draft of this work to review a couple of weeks ago. Although things have gotten better, I noted what I saw as major problems with the draft as-is, and recommended HLI take its time to fix them - even though this would take a while, and likely miss the window of Giving Tuesday.
Unfortunately, HLI went ahead anyway with the problems I identified basically unaddressed. Also unfortunately (notwithstanding laudable improvements elsewhere) these problems are sufficiently major I think potential donors are ill-advised to follow the recommendations and analysis in this report.
In essence:
Study quality
It perhaps comes as little surprise that different studies on psychotherapy in LMICs report very different results:[1]
The x-axis is a standardized measure of effect size for psychotherapy in terms of wellbeing.[2] Most - but not all - show a positive effect (g > 0), but the range is vast, HLI excludes effect sizes over 2 as outliers (much more later), but 2 is already a large effect: to benchmark, it is roughly the height difference between male and female populations.
Something like an '(weighted) average effect size' across this set would look promising (~0.6) - to also benchmark, the effect size of cash transfers on (individual) wellbeing is ~0.1. Yet cash transfers (among many other interventions) have much less heterogeneous results: more like "0.1 +/- 0.1", not ~"0.6 multiply-or-divide by an integer". It seems important to understand what is going on.
One hope would be this heterogeneity can be explained in terms of the intervention and length of follow-up. Different studies did (e.g.) different sorts of psychotherapy, did more or less of it, and measured the outcomes at different points afterwards. Once we factor these things in to our analysis, this wide distribution seen when looking at the impact of psychotherapy in general sharpens into a clearer picture for any particular psychotherapeutic intervention. One can then deploy this knowledge to assess - in particular - the likely efficacy of a charity like Strongminds.
The report attempts this enterprise in section 4 of the report. I think a fair bottom line is despite these efforts, the overall picture is still very cloudy: the best model explains ~12% of the variance in effect sizes. But this best model is still better than no model (but more later), so one can still use it to make a best guess for psychotherapeutic interventions, even if there remains a lot of uncertainty and spread.
But there could be another explanation for why there's so much heterogeneity: there are a lot of low-quality studies, and low quality studies tend to report inflated effect sizes. In the worst case, the spread of data suggesting psychotherapy's efficacy is instead a mirage, and the effect size melts under proper scrutiny.
Hence why most systematic reviews do assess the quality of included studies and their risk of bias. Sometimes this is only used to give a mostly qualitative picture alongside the evidence synthesis (e.g. 'X% of our studies have a moderate to high risk of bias') or sometimes incorporated quantitatively (e.g. 'quality score' of studies included as a predictor/moderator, grouping by 'high/moderate/low' risk of bias, etc. - although all are controversial).
HLI's report does not assess the quality of its included studies, although it plans to do so. I appreciate GRADEing 90 studies or whatever is tedious and time consuming, but skipping this step to crack on with the quantitative synthesis is very unwise:[3] any such synthesis could be hugely distorted by low quality studies. And it's not like this is a mere possibility: I previously demonstrated in the previous meta-analysis that study registration status (one indicator of study quality) explained a lot of heterogeneity, and unregistered studies had on average a three times [!] greater effect size than registered ones.
The report notes it has done some things to help manage this risk. One is cutting 'outliers' (g > 2, the teal in the earlier histogram), and extensive assessment of publication bias/small study effects. These things do help: all else equal, I'd expect bigger studies to be methodologically better ones, so adjusting for small study effects does partially 'control' for study quality; I'd also expect larger effect sizes to arise from lower-quality work, so cutting them should notch up the average quality of the studies that remain.
But I do not think they help enough[4] - these are loose proxies for what we seek to understand. Thus the findings would be unreliable in virtue of this alone until after this is properly looked at. Crucially, the risk that these features could confound the earlier moderator analysis has not been addressed:[5] maybe the relationship of (e.g.) 'more sessions given -> greater effect' is actually due to studies of such interventions tend to be lower quality than the rest. When I looked last time things like 'study size' or 'registration status' explained a lot more of the heterogeneity than (e.g.) all of the intervention moderators combined. I suspect the same will be true this time too.
Publication bias
I originally suggested (6m ago?) that correction for publication bias/small study effects could be ~an integer division, so I am surprised the correction was a bit less: ~30%. Here's the funnel plot:[6]
Unsurprisingly, huge amounts of scatter, but the asymmetry, although there, does not leap off the page: the envelope of points is pretty rectangular, but you can persuade yourself it's a bit of a parallelogram, and there's denser part of it which indeed has a trend going down and to the right (so smaller study -> bigger effect).
But this only plots effect sizes g < 2 (those red, not teal, in the histogram). If we include all the studies again, this picture looks a lot clearer - the 'long tail' of higher effects tends to come from smaller studies, which are clearly asymmetric.
This effect, visible to the naked eye, also emerges in the statistics. The report uses a variety of numerical methods to correct for publication bias (some very sophisticated). All of them adjust the results much further downwards on the full data than when outliers are excluded to varying degrees (table B1, appendix). It would have a stark effect on the results - here's the 'bottom line' result if you take a weighted average of all the different methods, with different approaches to outlier exclusion - red is the full data, green is the outlier exclusion method the report uses.
Needless to say, this choice is highly material to the bottom line results: without excluding data, SM drops from ~3.6x GD to ~1.1x GD. Yet it doesn't get a look in for the sensitivity analysis, where HLI's 'less favourable' outlier method involves taking an average of the other methods (discounting by ~10%), but not doing no outlier exclusion at all (discounting by ~70%).[7]
Perhaps this is fine if outlier inclusion would be clearly unreasonable. But it's not: cutting data is generally regarded as dubious, and the rationale for doing so here is not compelling. Briefly:
The strongest argument given is that, in fact, some numerical methods to correct publication bias give absurd results if given the full data: i.e. one gives an adjusted effect size of -0.6, another -0.2. I could buy an adjustment that drives the effect down to roughly zero, but not one which suggests, despite almost all the data being fairly or very positive, we should conclude from these studies the real effect is actually (highly!) negative.
One could have a long argument on what the most appropriate response is: maybe just keep it, as the weighted average across methods is still sensible (albeit disappointing)? Maybe just drop those methods in particular and do an average of those giving sane answers on the full data? Should we keep g < 2 exclusion but drop p-curve analysis, as it (absurdly?) adjusts the effect slightly upwards? Maybe we should reweigh the averaging of different numerical methods by how volatile their results are when you start excluding data? Maybe pick the outlier exclusion threshold which results in the least disagreement between the different methods? Or maybe just abandon numerical correction, and just say "there's clear evidence of significant small study effects, which the current state of the art cannot reliably quantify and correct"?
So a garden of forking paths opens before us. All of these are varying degrees of 'arguable', and they do shift the bottom line substantially. One reason pre-specification is so valuable is it ties you to a particular path before getting to peek at the results, avoiding any risk a subconscious finger on the scale to push one down a path of still-defensible choices nonetheless favour a particular bottom line. Even if you didn't pre-specify, presenting your first cut as the primary analysis helps for nothing up my sleeve reasons.
It may be the prespecified or initial stab doesn't do a good job of expressing the data, and a different approach does better. Yet making it clear this subsequent analysis is post-hoc cautions a reader about potential risk of bias in analysis.
Happily, HLI did make a protocol for this work, made before they conducted the analysis. Unfortunately, it is silent on whether outlying data would be excluded, or by what criteria. Also unfortunately, because of this (and other things like the extensive discussion in the appendix discussing the value of outlier removal principally in virtue of its impact on publication bias correction), I am fairly sure the analysis with all data included was the first analysis conducted. Only after seeing the initial publication bias corrections did HLI look at the question of whether some data should be excluded. Maybe it should, but if it came second the initial analysis should be presented first (and definitely included in the sensitivity analysis).
There's also a risk the cloud of quantification buries the qualitative lede. Publication bias is known to be very hard to correct, and despite HLI compiling multiple numerical state of the art methods, they starkly disagree on what the correction factor should be (i.e. from <~0 to > 100%). So perhaps the right answer is we basically do not know how much to discount the apparent effects seen in the PT literature given it also appears to be an extremely compromised one, and if forced to give an overall number, any 'numerical bottom line' should have even wider error bars because of this.[9]
Bayesian methods
I previously complained that the guestimate/BOTEC-y approach HLI used in integrating information from the meta-analysis and the strongminds trial data couldn't be right, as it didn't pass various sanity tests: e.g. still recommending SM as highly effective even if you set the trial data to zero effect. HLI now has a much cleverer Bayesian approach to combining sources of information. On the bright side, this is mechanistically much clearer as well as much cleverer. On the downside, the deck still looks pretty stacked.
Starting at the bottom, here's how HLI's Bayesian method compares SM to GD:
The informed prior (in essence) uses the meta-analysis findings with some monte carlo to get an expected effect for an intervention with strongminds-like traits (e.g. same number of sessions, same deliverer, etc.). The leftmost point of the solid line gives the expectation for the prior: so the prior is that SM is ~4x GDs cost effectiveness (dashed line).
The x axis is how much weight one gives to SM-specific data. Of interest, the line slopes down, so the data gives a negative update on SMs cost-effectiveness. This is because HLI - in anticipation of the Baird/Ozler RCT likely showing disappointing results - discounted the effect derived from the original SM-specific evidence by a factor of 20, so the likelihood is indeed much lower than the prior. Standard theory gives the appropriate weighting of this vs. the prior, so you adjust down a bit, but not a lot, from the prior (dotted line).
Despite impeccable methods, these results are facially crazy. To illustrate:
I take it most readers would disagree with the model here too - e.g. if indeed the only RCT on strongminds is basically flat, that should be sufficient demote SM from putative 'top charity' status.
I think I can diagnose the underlying problem: Bayesian methods are very sensitive to the stipulated prior. In this case, the prior is likely too high, and definitely too narrow/overconfident. See this:
Per the dashed and dotted lines in the previous figure, the 'GiveDirectly bar' is fractionally below at the blue dashed line (the point estimate of the stipulated-SM data). The prior distribution is given in red. So the expectation (red dashed line) is indeed ~4x further from the origin (see above).
The solid red curve gives the distribution. Eyeballing the integrals reveals the problem: the integral of this distribution from the blue dashed line to infinity gives the models confidence psychotherapy interventions would be more cost-effective than GD. This is at least 99% of the area, if not 99.9% - 99.99%+. A fortiori, this prior asserts it is essentially certain the intervention is beneficial (total effect >0).
I don't think anyone should think that any intervention is P > 0.99 more cost-effective than give directly (or P < 0.0001 or whatever it is in fact harmful) as a prior,[12] but if one did, it would indeed take masses of evidence to change one's mind. Hence the very sluggish moves in response to adverse data (the purple line suggests the posterior is also 99%+ confident SM is better than givedirectly).
I think I can also explain the underlying problem of this underlying problem. HLI constructs its priors exclusively from its primary meta-analytic model (albeit adapted to match the intervention of interest, and recalculated excluding any studies done on this intervention to avoid double counting). Besides the extra uncertainty (so spread) likely implied by variety of factors covered in the sensitivity analysis, in real life our prior would be informed by other things too: the prospect entire literatures can be misguided, a general sense (at least for me) that cash transfers are easy to beat in principle, but much harder in practice, and so on.
In reality, our prior-to-seeing-the-metaanalysis prior would be very broad and probably reasonably pessimistic, and (even if I'm wrong about the shortcomings I suggest earlier), the 'update' on reading it would be a bit upwards, and a little narrower, but not by that much. In turn, the 'update' on seeing (e.g.) disappointing RCT results for a given PT intervention would be a larger shift downwards, netting out that this was unlikely better than GiveDirectly after all.
If the Bayesian update was meant only to be a neat illustration, I would have no complaint. But instead the bottom line recommendations and assessments rely upon it - that readers should indeed adopt the supposed prior the report proposes about the efficacy of PT interventions in general. Crisply, I doubt the typical reader seriously believes (e.g.) basically any psychotherapy intervention in LMICs, so long as cost per patient is <$100, is a ~certain bet to beat cash transfers. If not, they should question the report's recommendations too.
Summing up
Criticising is easier than doing better. But I think this is a case where a basic qualitative description tells the appropriate story, the sophisticated numerical methods are essentially a 'bridge too far' given the low quality of what they have to work with, and so confuse rather than clarify the matter. In essence:
All of the figures are taken from the report and appendix. The transparency is praiseworthy, although it is a pity despite largely looking at the right things the report often mistakes the right conclusions to draw.
With all the well-worn caveats about measuring well-being.
The Cochrane handbook section on meta-analysis is very clear on this (but to make it clearer, I add emphasis)
As a WIP, the data and code for this report is not yet out, but in my previous statistical noodling on the last one both study size and registration status significantly moderated the effect downwards when included together, suggesting indeed the former isn't telling you everything re. study quality.
The report does mention later (S10.2) controlling a different analysis for study quality, when looking at the effect of sample size itself:
I don't think this analysis is included in the appendix or similar, but later text suggests the 'study quality' correction is a publication bias adjustment. This analysis is least fruitful when applied to study scale, as measures of publication bias are measures of study size: so finding the effects of study scale are attenuated when you control for a proxy of study scale is uninformative.
What would be informative is the impact measures of 'study scale' or publication bias have on the coefficients for the primary moderators. Maybe they too could end up 'controlled away with quality variables, more of which that we haven't considered might be included'?
There are likely better explanations of funnel plots etc. online, but my own attempt is here.
The report charts a much wiser course on a different "Outlier?" question: whether to include very long follow-up studies, where exclusion would cut the total effect in half. I also think including everything here is fine too, but the report's discussion in S4.2 clearly articulates the reason for concern, displays what impact inclusion vs. exclusion has, and carefully interrogates the outlying studies to see whether they have features (beyond that they report 'outlying' results) which warrants exclusion. They end up going 'half-and-half', but consider both full exclusion and inclusion in sensitivity analysis.
If you are using study size as an (improvised) measure of study quality, excluding the smallest studies because on an informal read they are particularly low quality makes little sense: this is the trend you are interested in.
A similar type of problem crops up when one is looking at the effect of 'dosage' on PT efficacy.
The solid lines are the fit (blue linear, orange log) on the full data, whilst the dashed lines are fits with extreme values of dosage - small or large - excluded (purple). The report freely concedes its choices here are very theory led rather than data driven - and also worth saying getting more of a trend here makes a rod for SM and Friendship Bench's back, as these deliver smaller numbers of sessions than the average, so adjusting with the dashed lines and not the solid ones reduces the expected effect.
Yet the main message I would take from the scatter plot is the data indeed looks very flat, and there is no demonstrable dose-response relationship of PT. Qualitatively, this isn't great for face validity.
To its credit, the write-up does highlight this, but does not seem to appreciate the implications are crazy: any PT intervention, so long as it is cheap enough, should be thought better than GD, even if studies upon it show very low effect size (which would usually be reported as a negative result, as almost any study in this field would be underpowered to detect effects as low as are being stipulated):
The report describes this clearly itself, but seems to think this is a feature rather than a bug (my emphasis):
I'm not even sure that "P > 0.99 better than GD" would be warranted as posterior even for a Givewell recommended top charity, and I'd guess the GW staff who made the recommendation would often agree.
I think I agree with the rest of this analysis (or at least the parts I could understand). However, the following paragraph seems off:
Apologies if I'm being naive here, but isn't this just a known problem of first-order cost-effectiveness analysis, not with this particular analysis per se? I mean, since cheapness could be arbitrarily low (or at least down to $0.01), "better than GD" is a bit of a red herring, the claim is merely that a single (even high-quality) study is not enough for someone to update their prior all the way down to zero, or negative.
And stated in English, this seems eminently reasonable to me. There might be good second-order etc reasons to not act on a naive first-order analysis (eg risk/ambiguity aversion, wanting to promote better studies, etc). But ultimately I don't think that literal claim is crazy to me, and naively seems like something that naturally falls out of a direct cost-effectiveness framework.
So the problem I had in mind was in the parenthetical in my paragraph:
To elaborate: the actual data on Strongminds was a n~250 study by Bolton et al. 2003 then followed up by Bass et al. 2006. HLI models this in table 19:
So an initial effect of g = 1.85, and a total impact of 3.48 WELLBYs. To simulate what the SM data will show once the (anticipated to be disappointing) forthcoming Baird et al. RCT is included, they discount this[1] by a factor of 20.
Thus the simulated effect size of Bolton and Bass is now ~0.1. In this simulated case, the Bolton and Bass studies would be reporting negative results, as they would not be powered to detect an effect size as small as g = 0.1. To benchmark, the forthcoming Baird et al. study is 6x larger than these, and its power calculations have minimal detectable effects g = 0.1 or greater.
Yet, apparently, in such a simulated case we should conclude that Strongminds is fractionally better than GD purely on the basis of two trials reporting negative findings, because numerically the treatment groups did slightly (but not significantly) better than the control ones.
Even if in general we are happy with 'hey, the effect is small, but it is cheap, so it's a highly cost-effective intervention', we should not accept this at the point when 'small' becomes 'too small to be statistically significant'. Analysis method + negative findings =! fractionally better in expectation vs. cash transfers, so I take it as diagnostic the analysis is going wrong.
I think 'this' must be the initial effect size/intercept, as 3.48 * 0.05 ~ 1.7 not 3.8. I find this counter-intuitive, as I think the drop in total effect should be super not sub linear with intercept, but ignore that.
Thank you for your comments, Gregory. We’re aware you have strong views on the subject and we appreciate your conscientious contributions. We discussed your previous comments internally but largely concluded revisions weren’t necessary as we (a) had already considered them in the report and appendix, (b) will return to them in later versions and didn’t expect they would materially affect the results, or (c) simply don’t agree with these views. To unpack:
This is a working report, and we’ll be reflecting on how to incorporate the above, similarly psychotherapy-sceptical perspectives, and other views in the process of preparing it for academic review. In the interests of transparency, we don’t plan to engage beyond our comments above so as to preserve team resources.
We find an initial effect is 0.70 SDs, reduced to 0.46 SDs after publication bias adjustments. Cuijpers et al. 2023 find an effect of psychotherapy of 0.49 SDs for studies with low risk of bias (RoB) in low, middle, and high income countries (comparisons = 218), which reduces to between 0.27 and 0.57 after publication adjustment. Tong et al. 2023 find an effect of 0.69 SDs for studies with low RoB in non-western countries (primarily low and middle income; comparisons = 36), which adjust to between 0.42 and 0.60 after publication correction. Hence, our initial and adjusted numbers are similar.
Epistemic status: tentative, it's been a long time since reading social science papers was a significant part of my life. Happy to edit/retract this preliminary view as appropriate if someone is able to identify mistakes.
I can't access Cuijpers et al., but I don't read Tong et al. as supporting what HLI has done here.
In their article, Tong et al. provide the effect size with no exclusions, then with outliers excluded, then with "extreme outliers" excluded (the latter of which seems to track HLI's removal criterion). They also provide effect size with various publication-bias measures employed. See PDF at 5-6. If I'm not mistaken, the publication bias measures are applied to the no-exclusions version, not a version with outliers removed or limited to those with lower RoB. See id. at 6 tbl.2 (n = 117 for combined and 2 of 3 publication-bias effect sizes; 153 with trim-and-fill adding 36 studies; n = 74 for outliers removed & n = 104 for extreme outliers removed; effect sizes after publication-bias measures range from 0.42 to 0.60 seem to be those mentioned in HLI's footnote above).
Tong et al. "conducted sensitive analyses comparing the results with and without the inclusion of extreme outliers," PDF at 5, discussing the results without exclusion first and then the results with exclusion. See id. at 5-6. Tables 3-5 are based on data without exclusion of extreme outliers; the versions of Tables 4 and 5 that excludes extreme outliers are relegated to the supplemental tables (not in PDF). See id. at 6. This reads to my eyes as treating both the all-inclusive and extreme-outliers-excluded data seriously, with some pride of place to the all-inclusive data.
I don't read Tong et al. as having reached a conclusion that either the all-inclusive or extreme-outliers-excluded results were more authoritative, saying things like:
Lastly, we were unable to explain the different findings in the analyses with vs. without extreme outliers. The full analyses that included extreme outliers may reflect the true differences in study characteristics, or they may imply the methodological issues raised by studies with effect sizes that were significantly higher than expected.
and
Therefore, the larger treatment effects observed in non-Western trials may not necessarily imply superior treatment outcomes. On the other hand, it could stem from variations in study design and quality.
and
Further research is required to explain the reasons for the differences in study design
and quality between Western and non-Western trials, as well as the different results in the analyses with and without extreme outliers.
PDF at 10.
Of course, "further research needed" is an almost inevitable conclusion of the majority of academic papers, and Tong et al. have the luxury of not needing to reach any conclusions to inform the recommended distribution of charitable dollars. But I don't read the article by Tong et al. as supporting the proposition that it is appropriate to just run with the outliers-excluded data. Rather, I read the article as suggesting that -- at least in the absence of compelling reasons to the contrary -- one should take both analyses seriously, but neither definitively.
I lack confidence in what taking both analyses seriously, but neither definitively would mean for purposes of conducting a cost-effectiveness analysis. But I speculate that it would likely involve some sort of weighting of the two views.
Hi again Jason,
When we said "Excluding outliers is thought sensible practice here; two related meta-analyses, Cuijpers et al., 2020c; Tong et al., 2023, used a similar approach" -- I can see that what we meant by "similar approach" was unclear. We meant that, conditional on removing outliers, they identify a similar or greater range of effect sizes as outliers as we do.
This was primarily meant to address the question raised by Gregory about whether to include outliers: “The cut data by and large doesn't look visually 'outlying' to me.”
To rephrase, I think that Cuijpers et al. and Tong et al. would agree that the data we cut looks outlying. Obviously, this is a milder claim than our comment could be interpreted as making.
Turning to wider implications of these meta-analyses, As you rightly point out, they don’t have a “preferred specification” and are mostly presenting the options for doing the analysis. They present analyses with and without outlier removal in their main analysis, and they adjust for publication bias without outliers removed (which is not what we do). The first analytic choice doesn’t clearly support including or excluding outliers, and the second – if it supports any option, favors Greg's proposed approach of correcting for publication bias without outliers removed.
I think one takeaway is that we should consider surveying the literature and some experts in the field, in a non-leading way, about what choices they’d make if they didn’t have “the luxury of not having to reach a conclusion”.
I think it seems plausible to give some weight to analyses with and without excluding outliers – if we are able find a reasonable way to treat the 2 out of 7 publication bias correction methods that produce the results suggesting that the effect of psychotherapy is in fact sizably negative. We'll look into this more before our next update.
Cutting the outliers here was part of our first pass attempt at minimising the influence of dubious effects, which we'll follow up with a Risk of Bias analysis in the next version. Our working assumption was that effects greater than ~ 2 standard deviations are suspect on theoretical grounds (that is, if they behave anything like SDs in an normal distribution), and seemed more likely to be the result of some error-generating process (e.g. data-entry error, bias) than a genuine effect.
We'll look into this more in our next pass, but for this version we felt outlier removal was the most sensible choice.
I recently discovered that GiveWell decided to exclude an outlier in their water chlorination meta-analysis. I'm not qualified to judge their reasoning, but maybe others with sufficient expertise will weigh in?
I recently discovered that GiveWell decided to exclude an outlier in their water chlorination meta-analysis. I'm not qualified to judge their reasoning, but maybe others with sufficient expertise will weigh in?
It looks like the same comment got posted several times?
Thanks Rebecca. I will delete the duplicates.
A comparatively minor point, but it doesn't seem to me that the claims in Greg's post [more] are meaningfully weakened by whether or not psychotherapy is well-studied (as measured by how many RCTs HLI has found on it, noting that you already push back on some object level disagreement on study quality in point 1, which feels more directly relevant).
It also seems pretty unlikely to be true that psychotherapy being well studied necessarily means that StrongMinds is a cost-effective intervention comparable to current OP / GW funding bars (which is one main point of contention), or that charity evaluators need 74+ RCTs in an area before recommending a charity. Is the implicit claim being made here is that the evidence for StrongMinds being a top charity is stronger than that of AMF, which is (AFAIK) based on less than 74 RCTs?[1]
GiveWell, Cochrane
I have previously let HLI have the last word, but this is too egregious.
Study quality: Publication bias (a property of the literature as a whole) and risk of bias (particular to each individual study which comprise it) are two different things.[1] Accounting for the former does not account for the latter. This is why the Cochrane handbook, the three meta-analyses HLI mentions here, and HLI's own protocol consider distinguish the two.
Neither Cuijpers et al. 2023 nor Tong et al. 2023 further adjust their low risk of bias subgroup for publication bias.[2] I tabulate the relevant figures from both studies below:
So HLI indeed gets similar initial results and publication bias adjustments to the two other meta-analyses they find. Yet - although these are not like-for-like - these other two meta-analyses find similarly substantial effect reductions when accounting for study quality as they do when assessing at publication bias of the literature as a whole.
There is ample cause for concern here:[3]
Evidentiary standards: Indeed, the report drew upon a large number of studies. Yet even a synthesis of 72 million (or whatever) studies can be misleading if issues of publication bias, risk of bias in individual studies (and so on) are not appropriately addressed. That an area has 72 (or whatever) studies upon it does not mean it is well-studied, nor would this number (nor any number) be sufficient, by itself, to satisfy any evidentiary standard.
Outlier exclusion: The report's approach to outlier exclusion is dissimilar to both Cuijpers et al. 2020 and Tong et al. 2023, and further is dissimilar with respect to features I highlighted as major causes for concern re. HLI's approach in my original comment.[6] Specifically:
The Cuijpers et al. 2023 meta-analysis previously mentioned also differs in its approach to outlier exclusion from HLI's report in the ways highlighted above. The Cochrane handbook also supports my recommendations on what approach should be taken, which is what the meta-analyses HLI cites approvingly as examples of "sensible practice" actually do, but what HLI's own work does not.
The reports (non) presentation of the stark quantitative sensitivity of its analysis - material to its report bottom line recommendations - to whether outliers are excluded is clearly inappropriate. It is indefensible if, as I have suggested may be the case, the analysis with outliers included was indeed the analysis first contemplated and conducted.[10] It is even worse if it was the publication bias corrections on the full data was what in fact prompted HLI to start making alternative analysis choices which happened to substantially increase the bottom line figures.
Bayesian analysis: Bayesian methods notoriously do not avoid subjective inputs - most importantly here, what information we attend to when constructing an 'informed prior' (or, if one prefers, how to weigh the results with a particular prior stipulated).
In any case, they provide no protection from misunderstanding the calculation being performed, and so misinterpreting the results. The Bayesian method in the report is actually calculating the (adjusted) average effect size of psychotherapy interventions in general, not the expected effect of a given psychotherapy intervention. Although a trial on Strongminds which shows it is relatively ineffectual should not update our view much the efficacy of psychotherapy interventions (/similar to Strongminds) as a whole, it should update us dramatically on the efficacy of Strongminds itself.
Although as a methodological error this is a subtle one (at least, subtle enough for me not to initially pick up on it), the results it gave are nonsense to the naked eye (e.g. SM would still be held as a GiveDirectly-beating intervention even if there were multiple high quality RCTs on Strongminds giving flat or negative results). HLI should have seen this themselves, should have stopped to think after I highlighted these facially invalid outputs of their method in early review, and definitely should not be doubling down on these conclusions even now.
Making recommendations: Although there are other problems, those I have repeated here make the recommendations of the report unsafe. This is why I recommended against publication. Specifically:
(1) and (2) combined should net out to SM < GD; (1) or (2) combined with some of the other sensitivity analyses (e.g. spillovers) will also likely net out to SM < GD. Even if one still believes the bulk of (appropriate) analysis paths still support a recommendation, this sensitivity should be made transparent.
E.g. Even if all studies in the field are conducted impeccably, if journals only accept positive results the literature may still show publication bias. Contrariwise, even if all findings get published, failures in allocation/blinding/etc. could lead to systemic inflation of effect sizes across the literature. In reality - and here - you often have both problems, and they only partially overlap.
Jason correctly interprets Tong et al. 2023: the number of studies included in their publication bias corrections (117 [+36 w/ trim and fill]) equals the number of all studies, not the low risk of bias subgroup (36 - see table 3). I do have access to Cuijpers et al. 2023, which has a very similar results table, with parallel findings (i.e. they do their publication bias corrections on the whole set of studies, not on a low risk of bias subgroup).
Me, previously:
From their discussion (my emphasis):
E.g. from the abstract (my emphasis):
Apparently, all that HLI really meant with "Excluding outliers is thought sensible practice here; two related meta-analyses, Cuijpers et al., 2020c; Tong et al., 2023, used a similar approach" [my emphasis] was merely "[C]onditional on removing outliers, they identify a similar or greater range of effect sizes as outliers as we do." (see).
Yeah, right.
I also had the same impression as Jason that HLI's reply repeatedly strawmans me. The passive aggressive sniping sprinkled throughout and subsequent backpedalling (in fairness, I suspect by people who were not at the keyboard of the corporate account) is less than impressive too. But it's nearly Christmas, so beyond this footnote I'll let all this slide.
Me again (my [re-?]emphasis)
Said footnote:
The sentence in the main text this is a footnote to says:
Me again:
My remark about "Even if you didn't pre-specify, presenting your first cut as the primary analysis helps for nothing up my sleeve reasons" which Dwyer mentions elsewhere was a reference to 'nothing up my sleeve numbers' in cryptography. In the same way picking pi or e initial digits for arbitrary constants reassures the author didn't pick numbers with some ulterior purpose they are not revealing, reporting what one's first analysis showed means readers can compare it to where you ended up after making all the post-hoc judgement calls in the garden of forking paths. "Our first intention analysis would give x, but we ended up convincing ourselves the most appropriate analysis gives a bottom line of 3x" would rightly arouse a lot of scepticism.
I've already mentioned I suspect this is indeed what has happened here: HLI's first cut was including all data, but argued itself into making the choice to exclude, which gave a 3x higher 'bottom line'. Beyond "You didn't say you'd exclude outliers in your protocol" and "basically all of your discussion in the appendix re. outlier exclusion concerns the results of publication bias corrections on the bottom line figures", I kinda feel HLI not denying it is beginning to invite an adverse inference from silence. If I'm right about this, HLI should come clean.
I'm feeling confused by these two statements:
The first statement says HLI's recommendation is unsafe, but the second implies it is reasonable as long as the sensitivity is clearly explained. I'm grateful to Greg for presenting the analysis paths which lead to SM < GD, but it's unclear to me how much those paths should be weighted compared to all the other paths which lead to SM > GD.
It's notable that Cuijpers (who has done more than anyone in the field to account for publication bias and risk of bias) is still confident that psychotherapy is effective.
I was also surprised by the use of 'unsafe'. Less cost-effective maybe, but 'unsafe' implies harm and I haven't seen any evidence to support that claim.
You cannot use the distribution for the expected value of an average therapy treatment as the prior distribution for a SPECIFIC therapy treatment, as there will be a large amount of variation between possible therapy treatments that is missed when doing this. Your prior here is that there is a 99%+ chance that StrongMinds will work better than GiveDirectly before looking at any actual StrongMinds results, this is a wildly implausible claim.
You also state "If one holds that the evidence for something as well-studied as psychotherapy is too weak to justify any recommendations, charity evaluators could recommend very little." Nothing in Gregory's post suggests that he thinks anything like this, he gives a g of ~0.5 in his meta-analysis that doesn't improperly remove outliers without good cause. A g of ~0.5 suggests that individuals suffering from depression would likely greatly benefit from seeking therapy. There is a massive difference between "evidence behind psychotherapy is too weak to justify any recommendations" and claiming that "this particular form of therapy is not vastly better than GiveDirectly with a probability higher than 99% before even looking at RCT results". Trying to throw out Gregory's claims here over a seemingly false statement about his beliefs seems pretty offensive to me.
[Disclaimer: I worked at HLI until March 2023. I now work at the International Alliance of Mental Health Research Funders]
Gregory says
That is a strong claim to make and it requires him to present a convincing case that GiveDirectly is more cost-effective than StrongMinds. I've found his previous methodological critiques to be constructive and well-explained. To their credit, HLI has incorporated many of them in the updated analysis. However, in my opinion, the critiques he presents here do not make a convincing case.
Taking his summary points in turn...
I think this is much too strong. The three meta-analyses (and Gregory's own calculations) give me confidence that psychotherapy in LMICs is effective, although the effects are likely to be small.
There is no consensus on the appropriate methodology for adjusting publication bias. I don't have an informed opinion on this, but HLI's approach seems reasonable to me and I think it's reasonable for Greg to take a different view. From my limited understanding, neither approach makes GiveDirectly more cost-effective.
We don't have any new data on StrongMinds so I'm confused why Greg thinks it's "less and less promising". HLI's Bayesian approach is a big improvement on the subjective weightings they used in the first cost-effectiveness analysis. As with publication bias, it's reasonable to hold different views on how to construct the prior, but personally, I do believe that any psychotherapy intervention in LMICs, so long as cost per patient is <$100, is a ~certain bet to beat cash transfers. There are no specific models of psychotherapy that perform better than the others, so I don't find it surprising that training people to talk to other people about their problems is a more cost-effective way to improve wellbeing in LMICs. Cash transfers are much more expensive and the effects on subjective wellbeing are also small.
HLI had to start somewhere and I think we should give credit to StrongMinds for being brave enough to open themselves up to the scrutiny they've faced. The three meta-analyses and the tentative analysis of Friendship Bench suggest there is 'altruistic gold' to be found here and HLI has only just started to dig. The field is growing quickly and I'm optimistic about the trajectories of CE-incubated charities like Vida Plena and Kaya Guides.
In the meantime, although the gap between GiveDirectly and StrongMinds has clearly narrowed, I remain unconvinced that cash is clearly the better option (but I do remain open-minded and open to pushback).
A specific therapy treatment is drawn from the distribution of therapy treatments. Our best guess about the distribution of value of a specific therapy treatment, without knowing anything about it, should take into account only that it comes from this distribution of therapy treatments. So I don't see what's unreasonable about this.
When running a meta-analysis, you can either use a fixed effect assumption (that all variation between studies is just due to sampling error) and a random effect assumption (that studies differ in terms of their "true effects".) Therapy treatments differ greatly, so you have to use a random effects model in this case. Then the prior you use for strong minds impact should have a variance that is the sum of the variance in the estimate of average therapy treatments effects AND the variance among different types of treatments effects, both numbers should be available from a random effects meta-analysis. I'm not quite sure what HLI did exactly to get their prior for strong minds here, but for some reason the variance on it seems WAY too low, and I suspect that they neglected the second type of variance that they should have gotten from a random effects meta-analysis.
Section 2.2.2 of their report is titled "Choosing a fixed or random effects model". They discuss the points you make and clearly say that they use a random effects model. In section 2.2.3 they discuss the standard measures of heterogeneity they use. Section 2.2.4 discusses the specific 4-level random effects model they use and how they did model selection.
I reviewed a small section of the report prior to publication but none of these sections, and it only took me 5 minutes now to check what they did. I'd like the EA Forum to have a higher bar (as Gregory's parent comment exemplifies) before throwing around easily checkable suspicions about what (very basic) mistakes might have been made.
Yes, some of Greg's examples point to the variance being underestimated, but the problem does not inherently come from the idea of using the distribution of effects as the prior, since that should include both the sampling uncertainty and true heterogeneity. That would be the appropriate approach even under a random effects model (I think; I'm more used to thinking in terms of Bayesian hierarchical models and the equivalence might not hold)
(@Burner1989 @David Rhys Bernard @Karthik Tadepalli)
I think the fundamental point (i.e. "You cannot use the distribution for the expected value of an average therapy treatment as the prior distribution for a SPECIFIC therapy treatment, as there will be a large amount of variation between possible therapy treatments that is missed when doing this.") is on the right lines, although subsequent discussion of fixed/random effect models might confuse the issue. (Cf. my reply to Jason).
The typical output of a meta-analysis is an (~) average effect size estimate (the diamond at the bottom of the forest plot, etc.) The confidence interval given for that is (very roughly)[1] the interval we predict the true average effect likely lies. So for the basic model given in Section 4 of the report, the average effect size is 0.64, 95% CI (0.54 - 0.74). So (again, roughly) our best guess of the 'true' average effect size of psychotherapy in LMICs from our data is 0.64, and we're 95% sure(*) this average is somewhere between (0.54, 0.74).
Clearly, it is not the case that if we draw another study from the same population, we should be 95% confident(*) the effect size of this new data point will lie between 0.54 to 0.74. This would not be true even in the unicorn case there's no between study heterogeneity (e.g. all the studies are measuring the same effect modulo sampling variance), and even less so when this is marked, as here. To answer that question, what you want is a prediction interval.[2] This interval is always wider, and almost always significantly so, than the confidence interval for the average effect: in the same analysis with the 0.54-0.74 confidence interval, the prediction interval was -0.27 to 1.55.
Although the full model HLI uses in constructing informed priors is different from that presented in S4 (e.g. it includes a bunch of moderators), they appear to be constructed with monte carlo on the confidence intervals for the average, not the prediction interval for the data. So I believe the informed prior is actually one of the (adjusted) "Average effect of psychotherapy interventions as a whole", not a prior for (e.g.) "the effect size reported in a given PT study." The latter would need to use the prediction intervals, and have a much wider distribution.[3]
I think this ably explains exactly why the Bayesian method for (e.g.) Strongminds gives very bizarre results when deployed as the report does, but they do make much more sense if re-interpreted as (in essence) computing the expected effect size of 'a future strongminds-like intervention', but not the effect size we should believe StrongMinds actually has once in receipt of trial data upon it specifically. E.g.:
In essence, the update we are interested in is not "How effective should we expect future interventions like Strongminds are given the data on Strongminds efficacy", but simply "How effective should we expect Strongminds is given the data on how effective Strongminds is". Given the massive heterogeneity and wide prediction interval, the (correct) informed prior is pretty uninformative, as it isn't that surprised by anything in a very wide range of values, and so on finding trial data on SM with a given estimate in this range, our estimate should update to match it pretty closely.[4]
(This also should mean, unlike the report suggests, the SM estimate is not that 'robust' to adverse data. Eyeballing it, I'd guess the posterior should be going down by a factor of 2-3 conditional on the stipulated data versus currently reported results).
I'm aware confidence intervals are not credible intervals, and that 'the 95% CI tells you where the true value is with 95% likelihood' strictly misinterprets what a confidence interval is, etc. (see) But perhaps 'close enough', so I'm going to pretend these are credible intervals, and asterisk each time I assume the strictly incorrect interpretation.
Cf. Cochrane:
Although I think the same mean, so it will give the right 'best guess' initial estimates.
Obviously, modulo all the other issues I suggest with both the meta-analysis as a whole, that we in fact would incorporate other sources of information into our actual prior, etc. etc.
Agree that there seem to be some strawmen in HLI's response:
Has anyone suggested that the "entire field of LMIC psychotherapy" is "bunk"?
Has anyone suggested that, either? As I understand it, it's typical to look at debatable choices that happen to support the author's position with a somewhat more skeptical lens if they haven't been pre-registered. I don't think anyone has claimed lack of certain choices being pre-registered is somehow fatal, only a factor to consider.
Hey Jason,
Our (the HLI) comment was in reference to these quotes.
I think it is valid to describe these as saying the literature is compromised and (probably) uninformative. I can understand your complaint about the word “bunk”. Apologies to Gregory if this is a mischaracterization.
Regarding our comment:
And your comment:
Yeah, I think this is a valid point, and the post should have quoted Gregory directly. The point we were hoping to make here is that we’ve attempted to provide a wide range of sensitivity analyses throughout our report, to an extent that we think goes beyond most charity evaluations. It’s not surprising that we’ve missed some in this draft that others would like to see. Gregory’s comments mentioned “Even if you didn't pre-specify, presenting your first cut as the primary analysis helps for nothing up my sleeve reasons” seemed to imply that we were deliberately hiding something, but in my view our interpretation was overly pessimistic.
Cheers for keeping the discourse civil.
Would it have been better to start with a stipulated prior based on evidence of short-course general-purpose[1] psychotherapy's effect size generally, update that prior based on the LMIC data, and then update that on charity-specific data?
One of the objections to HLI's earlier analysis was that it was just implausible in light of what we know of psychotherapy's effectiveness more generally. I don't know that literature well at all, so I don't know how well the effect size in the new stipulated prior compares to the effect size for short-course general-purpose psychotherapy generally. However, given the methodological challenges with measuring effect size in LMICs on available data, it seems like a more general understanding of the effect size should factor into the informed prior somehow. Of course, the LMIC context is considerably different than the context in which most psychotherapy studies have been done, but I am guessing it would be easier to manage quality-control issues with the much broader research base available. So both knowledge bases would likely inform my prior before turning to charity-specific evidence.
[Edit 6-Dec-23: Greg's response to the remainder of this comment is much better than my musings below. I'd suggest reading that instead!]
To my not-very-well-trained eyes, one hint to me that there's an issue with application of Bayesian analysis here is the failure of the LMIC effect-size model to come anywhere close to predicting the effect size suggested by the SM-specific evidence. If the model were sound, it would seem very unlikely that the first organization evaluated to the medium-to-in-depth level would happen to have charity-specific evidence suggesting an effect size that diverged so strongly from what the model predicted. I think most of us, when faced with such a circumstance, would question whether the model was sound and would put it on the shelf until performing other charity-specific evaluations at the medium-to-in-depth level. That would be particularly true to the extent the model's output depended significantly on the methodology used to clean up some problems with the data.[2]
By which I mean not psychotherapy for certain narrow problems (e.g., CBT-I for insomnia, exposure therapy for phobias).
If Greg's analysis is correct, it seems I shouldn't assign the informed prior much more credence than I have credence in HLI's decision to remove outliers (and to a lesser extent, its choice of a method). So, again to my layperson way of thinking, one partial way of thinking about the crux could be that the reader must assess their confidence in HLI's outlier-treatment decision vs. their confidence in the Baird/Ozler RCT on SM.
What prior to formally pick is tricky - I agree the factors you note would be informative, but how to weigh them (vs. other sources of informative evidence) could be a matter of taste. However, sources of evidence like this could be handy to use as 'benchmarks' to see whether the prior (/results of the meta-analysis) are consilient with them, and if not, explore why.
But I think I can now offer a clearer explanation of what is going wrong. The hints you saw point in this direction, although not quite as you describe.
One thing worth being clear on is HLI is not updating on the actual SM specific evidence. As they model it, the estimated effect on this evidence is an initial effect of g = 1.8, and a total effect of ~3.48 WELLBYs, so this would lie on the right tail, not the left, of the informed prior.[1] They discount the effect by a factor of 20 to generate the data they feed into their Bayesian method. Stipulating data which would be (according to their prior) very surprisingly bad would be in itself a strength, not a concern, of the conservative analysis they are attempting.
Next, we need to distinguish an average effect size from a prediction interval. The HLI does report both (Section 4) for a more basic model of PT in LMICs. The (average, random) effect size is 0.64 (95% CI 0.54 to 0.74), whilst the prediction interval is -0.27 to 1.55. The former is giving you the best guess of the average effect (with a confidence interval), the latter is telling you - if I do another study like those already included, the range I can expect its effect size to be within. By loose analogy: if I sample 100 people and their average height is roughly 5' 7" (95% CI 5'6" to 5'8"), the 95% range of the individual heights will range much more widely (say 5' 0" to 6' 2")
Unsurprisingly (especially given the marked heterogeneity), the prediction interval is much wider than the confidence interval around the average effect size. Crucially, if our 'next study' reports an effect size of (say) 0.1, our interpretation typically should not be: "This study can't be right, the real effect of the intervention it studies must be much closer to 0.6". Rather, as findings are heterogeneous, it is much more likely a study which (genuinely) reports a below average effect.[2] Back to the loose analogy, we would (typically) assume we got it right if we measured some more people at (e.g.) 6'0" and 5'4", even though these are significantly above or below the 95% confidence interval of our average, and only start to doubt measurements much outside our prediction interval (e.g. 3'10", 7'7").
Now the problem with the informed prior becomes clear: it is (essentially) being constructed with confidence intervals of the average, not prediction intervals for its data from its underlying models. As such, it is a prior not of "What is the expected impact of a given PT intervention", but rather "What is the expected average impact of PT interventions as a whole".[3]
With this understanding, the previously bizarre behaviour is made sensible. For the informed prior should assign very little credence to the average impact of PT overall being ~0.4 per the stipulated Strongminds data, even though it should not be that surprised that a particular intervention (e.g. Strongminds!) has an impact much below average, as many other PT interventions studied also do (cf. Although I shouldn't be surprised if I measure someone as 5'2", I should be very surprised if the true average height is actually 5'2", given my large sample averages 5'7"). Similarly, if we are given a much smaller additional sample reporting a much different effect size, the updated average effect should remain pretty close to the prior (e.g. if a handful of new people have heights < 5'4", my overall average goes down a little, but not by much).
Needless to say, the results of such an analysis, if indeed for "average effect size of psychotherapy as a whole" are completely inappropriate for "expected effect size of a given psychotherapy intervention", which is the use it is put to in the report.[4] If the measured effect size of Strongminds was indeed ~0.4, the fact psychotherapy interventions ~average substantially greater effects of ~1.4 gives very little reason to conclude the effect of Strongminds is in fact much higher (e.g. ~1.3). In the same way, if I measure your height is 5'0", the fact the average heights of other people I've measured is 5'7" does not mean I should conclude you're probably about 5'6".[5]
Minor: it does lie pretty far along the right tail of the prior (<top 1st percentile?), so maybe one could be a little concerned. Not much, though: given HLI was searching for particularly effective PT interventions in the literature, it doesn't seem that surprising that this effort could indeed find one at the far-ish right tail of apparent efficacy.
Cf. Cuijpers et al. 2020
Cf. your original point about a low result looking weird given the prior. Perhaps the easiest way to see this is to consider a case where the intervention is harmful. The informed prior says P (ES < 0) is very close to zero. Yet >1/72 studies in the sample did have an effect size < 0. So obviously a prior of an intervention should not be that confident in predicting it will not have a -ve effect. But a prior of the average effect of PT interventions should be that confident this average is not in fact negative, given the great majority of sampled studies show substantially +ve effects.
In a sense, the posterior is not computing the expected effect of StrongMinds, but rather the expected effect of a future intervention like StrongMinds. Somewhat ironically, this (again, simulated) result would be best interpreted as an anti-recommendation: Strongminds performs much below the average we would expect of interventions similar to it.
It is slightly different for measured height as we usually have very little pure measurement error (versus studies with more significant sampling variance). So you'd update a little less towards the reported study effects vs. the expected value than you would for height measurements vs. the average. But the key points still stand.
Hi Jason,
1. To your first point, I think adding another layer of priors is a plausible way to do things – but given the effects of psychotherapy in general appear to be similar to the estimates we come up with[1] – it’s not clear how much this would change our estimates.
There are probably two issues with using HIC RCTs as a prior. First, incentives that could bias results probably differ across countries. I’m not sure how this would pan out. Second, in HICs, the control group (“treatment as usual”) is probably a lot better off. In a HIC RCT, there’s not much you can do to stop someone in the control group of a psychotherapy trial to go get prescribed antidepressants. However, the standard of care in LMICs is much lower (antidepressants typically aren’t an option), so we shouldn’t be terribly surprised if control groups appear to do worse (and the treatment effect is thus larger).
2. To your second point, does our model predict charity specific effects?
In general, I think it’s a fair test of a model to say it should do a reasonable job at predicting new observations. We can’t yet discuss the forthcoming StrongMinds RCT – we will know how well our model works at predicting that RCT when it’s released, but for the Friendship Bench (FB) situation, it is true that we predict a considerably lower effect for FB than the FB-specific evidence would suggest. But this is in part because we’re using a combination of charity specific evidence to inform our prior and the data. Let me explain.
We have two sources of charity specific evidence. First, we have the RCTs, which are based on a charity programme but not as it’s deployed at scale. Second, we have monitoring and evaluation data, which can show how well the charity intervention is implemented in the real world. We don’t have a psychotherapy charity at present that has RCT evidence of the programme as it's deployed in the real world. This matters because I think placing a very high weight on the charity-specific evidence would require that it has a high ecological validity. While the ecological validity of these RCTs is obviously higher than the average study, we still think it’s limited. I’ll explain our concern with FB.
For Friendship Bench, the most recent RCT (Haas et al. 2023, n = 516) reports an attendance rate of around 90% to psychotherapy sessions, but the Friendship Bench M&E data reports an attendance rate more like 30%. We discuss this in Section 8 of the report.
So for the Friendship Bench case we have a couple reasonable quality RCTs for Friendship Bench, but it seems like, based on the M&E data, that something is wrong with the implementation. This evidence of lower implementation quality should be adjusted for, which we do. But we include this adjustment in the prior. So we’re injecting charity specific evidence into both the prior and the data. Note that this is part of the reason why we don’t think it’s wild to place a decent amount of weight on the prior. This is something we should probably clean up in a future version.
We can’t discuss the details of the Baird et al. RCT until it’s published, but we think there may be an analogous situation to Friendship Bench where the RCT and M&E data tell conflicting stories about implementation quality.
This is all to say, judging how well our predictions fair when predicting the charity specific effects isn’t clearly straightforward, since we are trying to predict the effects of the charity as it is actually implemented (something we don’t directly observe), not simply the effects from an RCT.
If we try and predict the RCT effects for Friendship Bench (which have much higher attendance than the "real" programme), then the gap between the predicted RCT effects and actual RCT effects is much smaller, but still suggests that we can’t completely explain why the Friendship Bench RCTs find their large effects.
So, we think the error in our prediction isn't quite as bad as it seems if we're predicting the RCTs, and stems in large part from the fact that we are actually predicting the charity implementation.
Cuijpers et al. 2023 finds an effect of psychotherapy of 0.49 SDs for studies with low RoB in low, middle, and high income countries (comparisons = 218#), and Tong et al. 2023 find an effect of 0.69 SDs for studies with low RoB in non-western countries (primarily low and middle income; comparisons = 36). Our estimate of the initial effect is 0.70 SDs (before publication bias adjustments). The results tend to be lower (between 0.27 and 0.57, or 0.42 and 0.60) SDs when the authors of the meta-analyses correct for publication bias. In both meta-analyses (Tong et al. and Cuijpers et al.) the authors present the effects after using three publication bias corrected methods: trim-and-fill (0.6; 0.38 SDs), a limit meta-analysis (0.42; 0.28 SDs), and using a selection model (0.49; 0.57 SDs). If we averaged their publication bias corrected results (which they did without removing outliers beforehand) the estimated effect of psychotherapy would be 0.5 SDs and 0.41 for the two meta-analyses. Our estimate of the initial effect (which is most comparable to these meta-analyses), after removing outliers is 0.70 SDs, and our publication bias correction is 36%, implying that we estimate our initial effect to be 0.46 SDs. You can play around with the data they use on the metapsy website.
Thanks Joel nice one!
I'm interested in where this figure Congress from "cost per person treated for StrongMinds hasadeclined to $63" - that's a big change.
Hi Nick,
Good question. I haven't dug into this in depth, so consider this primarily my understanding of the story. I haven't gone through an itemized breakdown of StrongMinds costs on a year by year basis to investigate this further.
It is a big drop from our previous costs. But I originally did the research in Spring 2021, when 2020 was the last full year. That was a year with unusually high costs. I didn't use those costs because I assumed this was mostly a pandemic related aberration, but I wasn't sure how long they'd keep the more expensive practices like teletherapy they started during COVID (programmes can be sticky). But they paused their expensive teletherapy programme this year because of cost concerns (p. 5).
So $63 is a big change from $170, but a smaller change from $109 -- their pre-COVID costs.
What else accounts for the drop though? I think "scale" seems like a plausible explanation. The first part of the story is fixed / overhead costs being spread over a larger number of people treated with variable (per person) costs remaining stable. StrongMinds spends at least $1 million on overhead costs (office, salaries, etc). The more people are treated, the lower the per person costs (all else equal). The second part of the story is that I think it's plausible that variable costs (i.e., training and supporting the person delivering the therapy) are also decreasing. They've also shifted towards moving away from staff-centric delivery model to using more volunteers (e.g., community health workers), which likely depresses costs somewhat further. We discuss their scaling strategy and the complexities it introduces into our analysis a bit more around page 70 of the report.
Below I've attached StrongMinds most recent reporting about their number treated and cost per person treated, which gives a decent overall picture for how the costs and the number treated have changed over time.
Thanks yeah that's a great graphic. Do they include government salaries and other NGO costs as part of their costs too?
They only include costs to the legal entity of StrongMinds. To my understanding, this includes a relatively generous stipend they provide to the community health workers and teachers that are "volunteering" to provide StrongMinds or grants StrongMinds makes to NGOs to support their delivery of StrongMinds programs.
Note that 61% of their partnership treatments are through these volunteer+ arrangements with community health workers and teachers. I'm not too worried about this since I'm pretty sure there aren't meaningful additional costs to consider. these partnership treatments appear to be based on individual CHWs and teachers opting in. I also don't think that the delivery of psychotherapy is meaningfully leading them to do less of their core health or educational work.
I'd be more concerned if these treatments were happening because a higher authority (say school administrators) was saying "Instead of teaching, you'll be delivering therapy". The costs to deliver therapy could then reasonably seen to include the teacher's time and the decrease in teaching they'd do.
But what about the remaining 39% of partnerships (representing 24% of total treatments)? These are through NGOs. I think that 40% of these are delivered because StrongMinds is giving grants to these NGOs to deliver therapy in areas that StrongMinds can't reach for various reasons. The other 60% of NGO cases appears to be instances where the NGO is paying StrongMinds to train it to deliver psychotherapy. The case for causally attributing these cases of treatment to StrongMinds seems more dubious here, and I haven't gotten all the information I'd like, so to be conservative I assumed that none of these cases StrongMinds claims as its are attributable to it. This increases the costs by around 14%[1] because it's reducing the total number treated by around 14%.
Some preemptive hedging: I think my approach so far is reasonable, but my world wouldn't be rocked if I was later convinced this isn't quite the way to think about incorporating costs in a situation with more decentralized delivery and more unclear causal attribution for treatment.
But 1.14 * 59 is 67 not 63! Indeed. The cost we report is lower than $67 because we include an offsetting 7.4% discount to the costs to harmonize the cost figures of StrongMinds (which are more stringent about who counts as treated -- more than half of sessions completed are required) with Friendship Bench (who count anyone as treated as receiving at least 1 session). So 59 * (1 - 0.074) * 1.14 is $63. See page 69 of the report for the section where we discuss this.
Could you explain what the bars for AMF mean in Figure 2? I looked at page 80 and found the following values for "Overall cost-effectiveness in WELLBYs per $1,000 (xGD)"
AMF 56.16 (6.85x) under deprivationism
AMF 29.34 (3.58x) under TRIA
AMF 6.69 (0.82x) under epicureanism
I considered that the bars could reflect uncertainty about the neutral point from 0-5, but the bars look even wider than the figure on page 83 would suggest.
Hi Jason,
The bars for AMF in Figure 2 should represent the range of cost-effectiveness estimates that come from inputting different neutral points, and for TRIA the age of connectedness.
This differs from the values given in Table 25 on page 80 because, as we note below that table, the values there are based on assuming a neutral point of 2 and an TRIA age of connectedness of 15.
The bar also differs for the range given in Figure 13 on page 83 because the lowest TRIA value has an age of connectivity of 5 years, where in Figure 2 (here) we allow it to go as low as 2 years I believe[1].
I see that the footnote explaining this is broken, I'll fix that.
When I plug (Deprivationism, neutral point =0; TRIA, neutral point =0, age of connectedness = 2) into our calculator it spits out a cost-effectiveness of 91 WELLBYs per $1,000 for deprivationism and 78 for TRIA (age of connectivity = 2) -- this appears to match the upper end of the bar.
Thanks -- that helps. "The lines for AMF (the Against Malaria Foundation) are different from the others" was really confusing without the footnote call following it; it makes a lot more sense now after the fix!
Executive summary: This report updates a previous analysis on the cost-effectiveness of psychotherapy for depression in low- and middle-income countries (LMICs). It finds psychotherapy leads to substantial wellbeing improvements that last over time, with effects varying based on program specifics.
Key points:
This comment was auto-generated by the EA Forum Team. Feel free to point out issues with this summary by replying to the comment, and contact us if you have feedback.
I wonder with these types of meta-analyses of relatively squishy subjects like "happiness" whether all the studies are in fact truly measuring the same outcome variable, as well as the same inputs. Man is not a machine, least of all the "crooked timber" of the mind.