Optimizer's curse
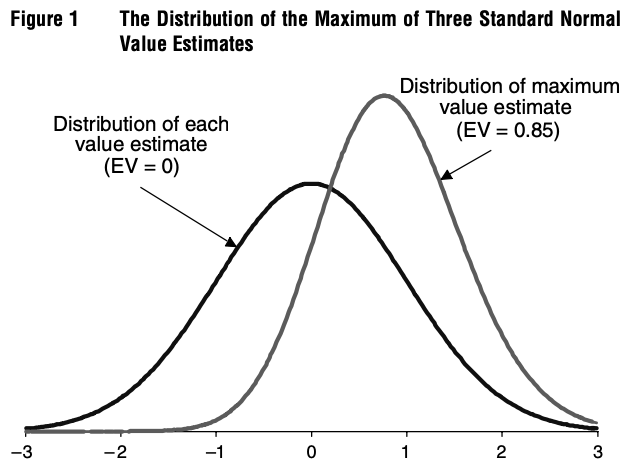
To illustrate the optimizer’s curse in a simple setting,suppose that we evaluate three alternatives that all have true values μi of exactly zero. The value of each alternative is estimated and the estimates Vi are independent and normally distributed with mean equal to the true value of zero (they are conditionally unbiased) and a standard deviation of one. Selecting the highest value estimate then amounts to selecting the maximum of three draws from a standard normal distribution. The distribution of this maximal value estimate is easily determined by simulation or using results from order statistics and is displayed in Figure 1. The mean of this distribution is 0.85, so in this case, the expected disappointment,E[Vi∗−μi∗], is 0.85.
When choosingThe optimizer's curse is the phenomenon that causes an option fromagent optimizing over a set set of options with uncertain utility, an optimizer will tendvalue to systematically overestimate the utilityvalue of theirthe chosen option. This phenomenon is known as
Illustration
The authors of the paper that originally introduced the optimizer's curse. provide a simple illustration of the phenomenon:[1]
To illustrate the optimizer’s curse in a simple setting, suppose that we evaluate three alternatives that all have true values μi of exactly zero. The value of each alternative is estimated and the estimates Vi are independent and normally distributed with mean equal to the true value of zero (they are conditionally unbiased) and a standard deviation of one. Selecting the highest value estimate then amounts to selecting the maximum of three draws from a standard normal distribution. The distribution of this maximal value estimate is easily determined by simulation or using results from order statistics and is displayed in Figure 1. The mean of this distribution is 0.85, so in this case, the expected disappointment,E[Vi∗−μi∗], is 0.85.
Smith, James E. & Robert L. Winkler (2006) The optimizer’s curse: skepticism and postdecision surprise in decision analysis, Management Science, vol. 52, pp. 311–322.
- ^
Smith, James E. & Robert L. Winkler (2006) The optimizer’s curse: skepticism and postdecision surprise in decision analysis, Management Science, vol. 52, pp. 312.
Further reading
Muehlhauser, Luke (2011) The optimizer’s curse and how to beat it, LessWrong, September 15.
Related entries
When choosing an option from a set of options with uncertain utility, an optimizer will tend to overestimate the utility of their chosen option. This phenomenon is known as the optimizer's curse.
See also: Goodhart's law