Summary
Mercy for Animals ran an online ad campaign that found no statistically significant result on whether online ads reduced people’s meat consumption. However, the study had only a 19% chance of detecting a difference of one serving of animal products a day between the treatment and control group (in either the positive or negative direction).
In an additional analysis, Jeff Kaufman found that there were two percentage points more people who reported not eating meat in the previous two days. This difference was not statistically significant, though our study only had a 30% chance of detecting this effect if it were real. This does, however, lead us to believe with 80% confidence that the true rate of online ad conversion is below 4.2% (and it could possibly be much less, even zero or negative).
In order to get adequate statistical power to answer the questions of meat reduction, we would have needed 9620 total, which 6.8x bigger than the actual sample size we recruited. However, in order to answer questions of meat elimination with adequate statistical power, we would only need 5380 participants, or 4x more than we actually recruited.
This study shows that it is really hard to create a good study. Even knowing the past mistakes of prior studies while making this one and even committing a lot of resources to avoid making those mistakes, we still managed to repeat some of those mistakes.
Introduction
Mercy for Animals (MFA) is a non-profit that aims to improve the welfare of nonhuman animals by encouraging people to reduce the amount of meat they eat, thereby reducing the amount of animals that are factory farmed (see “Why Eat Less Meat?” for why this is a good idea).
MFA accomplishes this through a variety of different methods, including online outreach, undercover investigations, grassroots outreach, social media, corporate outreach, and legal advocacy. However, while all these activities seem plausibly connected to encouraging meat reduction, it is still unclear whether any of these interventions actually work to improve nonhuman animal welfare and which interventions have the most return on investment. Therefore it is necessary to run scientific studies on the impact of these interventions.
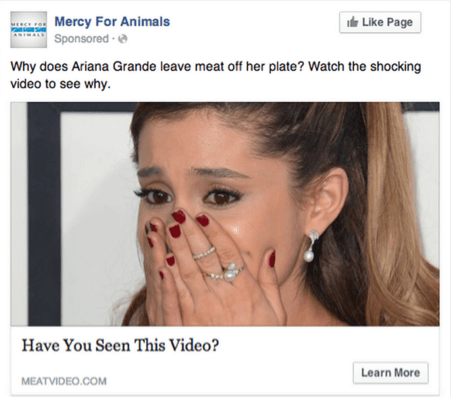
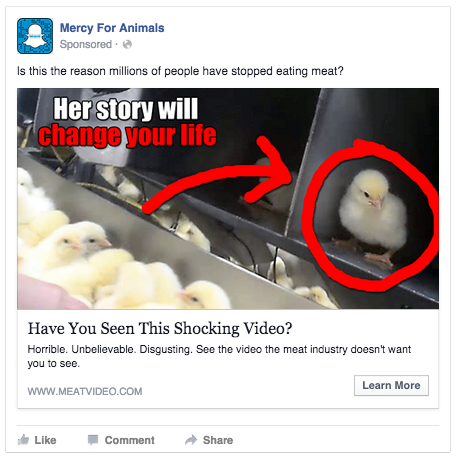
In 2014 and 2015, I worked with Mercy for Animals to plan out a methodology to study one intervention in particular -- online ads. The idea is that Mercy for Animals buys Facebook ads that point to shocking videos that expose the cruelty of factory farming. These ads are then targeted to those who prior research have found are most likely to go vegetarian as a result -- women aged 13-25.
I was attracted to online ads because of the scale and ease of implementation -- rather than going from college campus to college campus handing out leaflets, it seemed pretty easy to create a large-scale online ad campaign where the experiment could be done in a real-life setting while still being carefully controlled. So I worked with Nick Cooney, MFA, and some great donors. We bought the ads and half of them, at random, were pointed toward videos exposing factory farmed cruelty and the other half pointed to an unrelated video on neglected tropical diseases.
Unknown to those who clicked on the ads, a tracking cookie was put on their computer that allowed us to send them another advertisement several months later that pointed to a survey that asked them about diet preferences. The user themselves would not see any connection to MFA or the video they saw earlier, but based on their tracking cookie we would know whether they saw the control video or the treatment video.
We then tallied up the results and made some conclusions!
What did the study find?
Based on the published write-up by MFA (drawing upon independent research done by a third-party research firm), the key claims are:
Was the experimental group inspired to eat less meat?
“We asked participants how many servings of beef, pork, chicken, fish, eggs, and dairy they had consumed over the previous two days. We didn’t find a statistically significant difference in reported diet between the two groups.”
“Because of the extremely low power of our study, we don’t actually know whether the two groups’ diets were the same or slightly different. Our study was powered to detect a 10 percent difference between the groups, and since the differences between the groups were much smaller than that, we can’t be confident about whether the differences between the groups were due to chance or were the true group means.”
“Based on our study design, it appears we would have needed tens to hundreds of thousands of participants to properly answer this question.”
“We don’t know whether showing people farmed animal cruelty video in this context will cause them to slightly increase, slightly decrease, or sustain their consumption of animal products a few months later.”
Was the experimental group inspired to change their intentions about their diet?
“There was one statistically significant difference at the 95% level: People in the experimental group were more likely to identify as vegetarian” (though this claim could be spurious due to lack of controlling for testing multiple hypotheses[1].)
“At the 95% level, members of the control group were more likely to report that they didn’t intend to change the amount of meat they ate in the next four months.”
“At the 85% level, members of the experimental group were more likely to report that they intended to eat less meat; and they were also more likely to report that they intended to stop eating meat entirely.”
“If the ‘less meat’ and ‘no meat’ categories were combined into one general ‘reducer’ category, we would find a statistically significant difference at the 95% level, with the experimental group more likely to intend to eat less meat four months into the future.”
Was the experimental group inspired to change their attitudes about animals?
“We found only one statistically significant difference, at the 85% level. Those in the experimental group were more likely to strongly agree that cows, pigs, and chickens are intelligent, emotional individuals with unique personalities.”
What results did other people find?
Since MFA made the data public, anyone can re-analyze the data. There was one novel analysis by Jeff Kaufman that found an interesting effect:
“There were 970 control and 1054 experimental responses in the dataset they released. Of these, only 864 (89%) and 934 (89%) fully filled out this set of questions. I counted someone as a meat-eater if they answered anything other than ‘0 servings’ to any of the four meat-related questions, and a vegetarian otherwise.
[...] 2 [percentage points] more people in the experimental group were vegetarians than in the control group (p=0.108). Honestly, this is far higher than I expected. We're surveying people who saw a single video four months ago, and we're seeing that about 2 [percentage points] more of them are vegetarian than they would have been otherwise.”
I’ll talk about this a bit later, because I want to analyze all the claims made in order.
There was no statistically significant difference in diet between the treatment and control group. Does this matter?
If online ads work, it’s certainly not a good sign that this study did not find any statistically significant difference. However, it’s entirely possible that online ads work and that this study wasn’t strong enough to find a statistically significant difference.
Why? Imagine you want to test whether guys are taller than girls. So you find two guys and two girls. Bob is 5’5” and David is 5’6”. Alice is 5’4” and Carol is 5’7”. The average height for both groups is 5’5.5”. Does that mean we’ve conclusively proven there is no difference in height between guys and girls?
Well, no. Instead, it is just because our sample size was really small and didn’t give enough opportunity to see the true means and deviations of height across both genders. A sample size of four people isn’t enough to detect an effect with as much variation as height.
Detecting differences in meat eating is similar. There is a lot of natural variation in how much meat people eat, even if no one is intentionally trying to reduce their meat intake due to moral concerns. We need to get a large enough sample size to overcome this random variation in order to see if there’s any clear signal.
We therefore would like to calculate statistical power, which is a measure of how likely we would be to detect a true effect of a certain size, given the size of the control and treatment groups, and the size and standard deviation of the true effect. That is, if we’re deciding between the hypothesis that online ads have no effect and that online ads do have some positive effect, and in reality online ads do indeed have some positive effect, what is the probability that our study would pick up on that positive effect? The higher the variation in our variable of interest, the smaller the sample size of our study, and the smaller the true effect is, the harder it will be to detect a true effect, and the lower our statistical power will be.
In our study, we’re trying to judge whether or not online ads have a positive effect on reducing meat consumption, contrasted with finding no effect or a negative effect (i.e., that watching an online ad makes you more likely to eat meat). For this study, there was a statistical power of 19%[2], or a 19% chance of detecting a non-zero effect (either positive or negative) given that there was a true effect.
However, while hopefully online ads don’t have a counterproductive, negative effect, we still would like to be able to tell whether the true effect exists and is greater than 0. For this, we would need more statistical power, which would mean we would need a larger sample size.
How many people would we have needed in the study to have achieved proper statistical power?
So our study had a power of 0.19[2], which is pretty dismal. Instead, the academic standard is for a power of 0.8 or higher, making the chance of failing to detect that online ads work 20% or less, assuming that online ads work. (This would also mean that if our study found no statistically significant effect and had a power of 0.8, we could be roughly 80% confident that online ads didn’t work.)
How many people would we need to get to a power of 0.8?
If you read MFA’s analysis, the answer looks pretty bad:
Our study was powered to detect a 10 percent difference between the groups, and since the differences between the groups were much smaller than that, we can’t be confident about whether the differences between the groups were due to chance or were the true group means. So unfortunately, our pool of participants wasn’t large enough to answer our key question. Based on our study design, it appears we would have needed tens to hundreds of thousands of participants to properly answer this question.
However, Animal Charity Evaluator’s re-analysis is a bit more positive:
To have a statistical power of 80% in a future experiment, assuming the group means are the same as in this experiment and the common standard deviation is equal to the average standard deviation of this experiment (from both experimental groups) and using the same statistical test, it would need 3,210 participants in each group.
When I do the math[3], I find the need for 4810 participants in each group (9620 total, or 6.8x bigger than the actual sample size). This is higher than ACE’s estimate[4], but quite far from MFA’s quote of “hundreds of thousands of participants”[5].
Why was the study underpowered? Why didn’t we recruit all the people we needed?
In order to fund the study, MFA spent $28K from their existing online ad budget to buy treatment ads. We then found private donors to fund $28K in control ads. Private donors also contributed $8K in advertisements that pointed to the follow-up survey and participation incentives for that survey. This lead us collect over 200K people into our treatment and control pages (from untold millions of people who saw the ad, at $0.17 per click), which is a really great start.
It would have been awesome if we could have funnelled all 200K people who saw one of the two pages into taking a survey. However, the retargeting required the participants to click on yet another ad advertising the survey (at ~$1 in cost-per-click and the incentive offered per person), and fewer than 2% of our original population did so (the “response rate”).
This low response rate was lower than we expected (despite doing actual piloting of the study to determine a guess at the response rate) and led to a large degree of subjects inadvertently dropping out[6] and we weren’t able to get a large enough sample size despite paying so much money.
In order to boost the sample size, we need some combination of a higher response rate and a larger initial sample. We were genuinely expecting a higher response rate[6], but there’s not much we can do except consider a different study design or consider better incentives for the study. It’s also harder to create a larger initial sample size due to constraints on funding and constraints on just how many ads MFA can get onto Facebook before saturating their entire market of English-speaking women age 13-25.
More details about how to re-run the study better are discussed below.
People in the experimental group were more likely to identify as vegetarian (95% significance). Does that matter?
Likely no.
This is a neat effect to find, however we’ve found time and time again that people don’t really know what it means to be “vegetarian” and that vegetarians eat meat[7], as we saw it in the ACE flyering study.
Put simply, talk is cheap[8], and any changes in people becoming vegetarian should show up with similar statistical significance in the actual data on how much meat was eaten. So I’d be inclined to say this effect doesn’t matter.
The experimental and control groups differed on their stated intentions about how much meat they’ll eat in the future. Does that matter?
Likely no.
Again, talk is cheap and most intentions don’t actually translate into action -- just think about how many people have a stated intention to go to the gym versus how many people actually do. And given that there were several months between when people saw the video and when people were surveyed, they had a good deal of time to turn their intention into action but haven’t yet.
Furthermore, the MFA study gets creative with statistical significance testing and might be claiming effects that don’t actually exist. Certainly, testing at the 95-level is traditional yet ultimately arbitrary and testing at the 85-level could be appropriate as well. But it feels to me like stretching too much to find an effect that may or may not be there and -- even if it is there -- doesn’t really add up to much.
Additionally, while MFA did admirably include multiple hypothesis corrections for their age-related analysis, they did not correct for testing multiple hypotheses outside this. By my count, MFA makes 13 different hypothesis tests. If we assumed all the tests were just random noise, the presence of 13 tests would still lead us to find, on average, 1.95 tests statistically significant at the 85-level and 0.65 tests statistically significant at the 95-level (inclusive of the tests significant at the 85-level).
The experimental group reported higher agreement with the claim that “that cows, pigs, and chickens are intelligent, emotional individuals with unique personalities”. Does that matter?
Likely no, for similar reasons as discussed earlier. Beliefs and attitudes are nice. They’re certainly better than nothing. Maybe they’ll even help create a societal shift or cause someone to go vegetarian many years down the road. However, they just as well might not.
Jeff Kaufman found that the experimental group had two percentage points more vegetarians. Does that matter?
Yes. We still don’t know enough to know if it is a real effect, but it gives us a clearer result and an easier-to-interpret upper bound.
Unlike finding people who had self-identified under the error-prone “vegetarian” label, Jeff Kaufman looked at the actual statements of how much meat people ate and coded people as vegetarian if they indicated they ate 0 meat over the two day period we asked about and non-vegetarian otherwise. He then found that there were 6.4% vegetarians in the control group and 8.4% in the experimental group, despite the odd result that the experimental group overall ate more meat.
Looking at vegetarian vs. non-vegetarian has several good things going for it: (a) it is less prone to errors introduced by people trying to guess how many servings they ate (e.g., misremembering the correct amount, not knowing how much a serving is, deliberately entering high numbers and creating bad outliers for the study) and (b) it is easier to interpret the results.
The downside of looking at vegetarian vs. non-vegetarian is that it won’t capture any of the impact from people reducing but not eliminating their meat consumption (or increasing their meat consumption as it may be), which means that looking at vegetarian vs. non-vegetarian should understate the effect. Also, the time period is only for two days, which could be a fluke and not indicative of enduring vegetarianism.
Before we make a big deal over the two percentage point change in vegetarianism, though, we must note that this change was not statistically significant with a p-value of 0.11 and it is entirely possible this effect is just due to chance and not due to the actual effect of online ads.
Instead, we should again look to statistical power, which is 0.30 in this example[9], or a 70% chance of failing to find a real effect. Better than the meat-based analysis, but still not good, and leaves us inconclusive over whether there is a real change in vegetarianism or not. We would have needed a sample size of 5380 to find an effect at the 0.8 level if participants were recruited into treatment and control evenly and had the same vegetarianism rates.
What does this tell us about an upper bound on diet change?
Looking at this study, we can tell that online ads aren’t perfect -- that is, they don’t convert every single person to vegetarianism, given how few of the people in the experimental group are vegetarian. But can we use our study to calculate an upper-bound on the effectiveness of online ads? Sure we may not know what the true effect of online ads is, but can we figure out what the maximum possible effect is, given what our study turned out?
It turns out that if you know two of the following three -- sample size, difference in the groups, and the statistical power level -- you can calculate the missing third. We already used the desired statistical power (0.8) and the observed difference in groups to calculate the necessary sample size needed to make an adequately powered study, and we’ve already used the observed difference in groups and actual sample size to determine the actual power of the study.
But we have one more trick -- we can use what we know to calculate an upper bound on the actual difference in meat eating, if we assume our study was powered at 0.8. Basically, we’re trying to figure out what is the smallest possible effect size we could have detected, given the study as it is. This gives us an 80% upper bound on the effect of online ads on diet change.
Redoing the analysis shows that the smallest effect we could detect with 80% confidence is a difference of 4.2% (assuming the control remains at 6.4% vegetarian). Therefore we can be 80% confident that the true effect of online ads is a rate below 4.2%[10].
We don’t know how much of the videos that viewers in the treatment group actually watched. Is that bad?
I don’t think so.
I’ve heard this criticism of the study a good deal. People are correct that we don’t have any data on whether or not people are watching the full video, but this doesn’t concern me.
Remember that we’re trying to test for the return on investment of funding a particular intervention. And that intervention isn’t about getting people to watch the full video -- it’s about funding ads for people to click on. And if people are clicking ads but not watching the entire video, that’s an important facet of this intervention to capture and is a legitimate part of the effect.
I did, however, notice that the pages in question have Google Analytics, so it may be possible to get information on the average amount of time people spend on the page across the experimental and the control groups. We could also get engagement metrics from the treatment and control pledges. This might shed more information on whether the videos were actually watched.
The analytics would be most useful if they could be limited solely to the people from the treatment or control group (such as by cookie or by the time the campaign was run), but even if that isn't possible I think the information may still be somewhat helpful.
The survey only asked about animal-related questions. Even though it wasn’t directly tied to MFA or any pro-animal group, wouldn’t this tip off the survey-taker and trigger social desirability bias?
It’s possible, but I’m not worried.
Social desirability bias is when you answer what you think the surveyor wants to hear rather than what is true. For example, you might overreport how much you’d be willing to donate to a cause, how much you go to the gym, or how vegetarian you are (since you believe it is healthy and virtuous). Could that be a problem here, when the questions seem all about how vegetarian you are?
We took this concern very seriously prior to running the study and we originally sought to make the survey up to three times as long by filling it with fake questions (e.g., about how much soda they drank, about whether they had a smartphone, etc.). This has the added benefit of disguising the intent of the survey and lowering social desirability, but has the added cost of making the survey longer and thus driving more participants to quit halfway through because the survey is too long.
So we decided to pilot on MTurk two different surveys -- one with and one without distraction items. Our conclusion was that there was no statistically significant differences in social desirability bias between the two surveys. This gave us enough confidence that even if there was some downside to lacking a disguise, this was more than made up for by the considerable cost of having a longer survey and reducing the resulting sample size.
Sounds like we’re testing a lot of different variables. Is that bad?
Yes, this is bad for a few different reasons: (a) it makes the survey longer and induces more survey fatigue, lowering the response rate; (b) it confuses the readers of the analysis as to what the study was trying to find out; and (c) it produces more opportunities for the authors of the analysis to p-fish by finding one statistically significant effect among many possible effects and then pointing only to that and ignoring the other effects.
Ideally we would have picked only one variable of interest and stuck with that.
Which variable of interest is most appropriate? Why?
This is where it gets thorny and why we didn’t end up picking only one variable.
The question about how many servings people ate is the most clearly supported by academic research and most accurately models meat reduction in addition to meat elimination. However, people have problems recalling precise figures and knowing what a serving is.
Looking at just meat elimination on the food frequency questionnaire (Jeff Kaufman’s analysis) provides for the clearest and easiest-to-interpret results but loses out on any information that might be gained by meat reduction. If you think that meat reduction instead of meat elimination will account for most of the impact of online ads, this variable of interest might be too reductive
Looking at changes in self-identification (e.g., whether you label yourself “vegetarian”), changes in intention (e.g., whether you intend to stop eating meat soon), and belief (e.g., whether you think animals are intelligent, emotional creatures) are good because these correlate with reduced meat consumption and have the potential for larger effect sizes that may be detectable when an actual change in meat consumption is not (due to higher variance and a smaller effect size, which makes it harder to get the correct statistical power). However, these variables aren’t very useful because their correlations are still mostly unproven and talk is cheap when it comes to action.
Therefore, I’d prefer that any future study only ask about a food frequency questionnaire (or, better yet find something more accurate!) and avoid the strong (and so far irresistible) temptation to include additional questions about identification, beliefs, or intention. Additionally, we may want to figure out methodologies we can use that do not rely on self-reported data at all, such as somehow tracking actual meat consumption.
How does this study improve on past studies?
Even though this study had insufficient statistical power to detect an effect, it is easy to understate how much of an improvement this study was on the prior studies that have been conducted.
This study is the largest to date, more than 3x the size of the second largest study. Also, this study is the first of its kind to have an equal-sized control group, 14x larger than any control group previously studied.
|
Name |
Date |
Treatment |
Control |
|
Fall 2011 |
104 people |
Did not use |
|
|
Fall 2012 |
"nearly 500” |
Did not use |
|
|
Fall 2013 |
123 |
23 (control leaflet), 477 (no leaflet) |
|
|
Fall 2013 |
169 |
60 |
|
|
Fall 2013 |
524 |
45 |
|
|
Winter 2014 |
404 |
213 |
|
|
MFA Study |
Spring 2016 |
934 |
864 |
Furthermore, this study is at much less risk than prior studies of non-response bias and response bias, as the follow-up survey looks entirely unrelated to MFA or nonhuman animals.
What does this mean for future studies?
This study shows that it is really hard to create a good study. Even going into making the study knowing the past mistakes of studies and committing a lot of resources to avoid making those mistakes, it is still possible to repeat those mistakes. The first mission of any future study should be to get an adequate sample size -- something that we have now tried and failed at six times in a row.
Secondly, this study shows that it is still premature to do lots of studies on the relative effectiveness of certain vegetarian messaging (e.g., should we talk about the environment? Should we advocate veganism and abolitionism or is advocating reducing meat the better approach? Which animal photos on the cover are most likely to get people to reduce their meat consumption?) when we don’t even know if the absolute effectiveness is there yet.
Instead, it is likely that the studies we need most are highly funded gold-standard studies that bring an exceptionally large treatment and control group on the question of whether or not interventions like online ads or leafleting work at all.
What does this mean for funding animal welfare charities?
Because the results are ultimately inconclusive, it is premature to deallocate funding from online ads and reallocate it to other interventions unless you were expecting the conversion rate of online ads to exceed 4%.
Additionally, this funding is overall unlikely to matter for those thinking to donate to a particular animal welfare charity, since so many charities invest different amounts in a large number of interventions, including online ads.
One implication this does have is that it would be great to fund more high-quality research when the opportunity arises. And with this study, MFA has certainly distinguished itself from other animal welfare studies that run research as the group offering the highest quality research so far.
Both MFA and ACE talk about how “the majority of impact comes from changing the behaviors of those who view the ad but never click on it” and that this study didn’t capture that impact. What’s that about?
In “Online Ads and Offine Sales: Measuring the Effects of Retail Advertising via a Controlled Experiment on Yahoo!”, researchers randomized 1.3M Yahoo! customers to either see ads from a particular company (80% of the group) or to see no ads from that company (20% of the group) over a particular two-week period. They were able to match these customers to actual consumer identities and found that 78% of sales generated by ads were from people who saw but did not click on the ad. Slate discusses a similar study with Facebook ads.
This makes some sense in the context of our online ads. Putting forth an online ad like “Find out why Ariana Grande leaves meat off her plate” or “have you seen this shocking video?” definitely induces some sort of treatment message to the viewer (e.g., Ariana Grande is appalled by eating meat and you should be too or millions of people are shocked into not eating meat) even if they don’t click on the ad and see the shocking video.
On the other hand, it might not make sense in the context of our online ads because the online ads in these studies were intentionally designed to inspire behavior despite not being clicked and were seen by the user dozens of times rather than once. While our veg ads are designed with somewhat similar intent and are seen multiple times, it’s not to nearly the same extent. Additionally, desiring a product is different psychologically from being induced to go vegetarian.
But there is some possibility that funding online ads is influencing people to eat less meat even though they never end up as part of our study (since we only surveyed people who clicked on the ads). This is still an interesting opportunity for future research[11].
What future research should be done along the lines of this online ads study?
Repeating this study again should be considered as a competitive opportunity. Even though we failed to get a good enough sample size the methodology is solid. While it looked like we would need enormous effect sizes to see a difference in meat reduction, we only need 5380 people to get an adequately powered look at meat elimination, which is only 3x larger than our current sample. If we could combine a future study with the data we have now[12], we’d only need to commit $128K and ten months[13] to get the data we needed.
This sounds like a lot, but it’s not as much as the initial reactions to the MFA study made me believe (i.e., millions of dollars) and is definitely feasible from the $1M ACE Research Program or the millions the Open Philanthropy Project is ready to commit to fund animal rights -- neither of which existed when this study was first funded.
Another idea is to find a better way to recruit participants that has a much higher response rate between the treatment and the follow-up survey with a lot less leakage of participants. With a higher response rate, we could have easily afforded to recruit tens of thousands of participants rather than barely be able to make it across the 2K mark. I’m still not sure how to do this without introducing a lot of response or non-response bias, however -- you can’t just have a pop-up at the end of the video that asks people to put in their email.
It’s possible we could do something in a controlled environment like Amazon’s Mechanical Turk, or some similar professional panel study, where participants would view the ad or video and then be contacted later to finish the study. This would have a significantly higher response rate though at the risk of added response bias (since people would likely know they’re part of an animal welfare study).
Endnotes
[1]: I don’t believe these calculation made any sort of attempt to correct for multiple hypothesis testing (e.g., Bonferroni corrections), though their statistics dealing with age did.
[2]: I assume the variable of interest is the amount of reduction of all animal products. To calculate this, download the raw data (see bottom of page), unzip it, and use “Courtesty of Edge - female only respondents.csv”, which is the “valid” data used by MFA containing only participants that were targeted through the ads (other participants must have been included through friends sharing links or something else). Q03 contains counts of all of the animal product servings per respondent and Quota_Group indicates 1 for control and 2 for experimental group.
Looking at the data for each group shows that there was an average of 10.44 servings of animal products consumed in the experimental group group (SD 7.1 servings) and 10.04 servings in the control group (SD 6.9). Given a sample size of 684 control and 749 experimental subjects, we arrive at a statistical power of 19% (You can either do the math directly or use an online calculator -- to use the calculator, enter these parameters).
[3]: Assuming that participants are collected in an even 1:1 ratio and future results have the same means and standard deviations, 80% power can be achieved with 9620 subjects (using this online calculator).
[4]: ACE didn’t explain how they arrived at their calculation, so it’s very difficult to compare and see which one of us went wrong or why we arrived at different results. However, on reply to my comment asking (see reply from Jacy Reese on their analysis at February 22, 2016), it appears they did a power calculation using two different group means and an overall SD.
My analysis uses slightly different data (the data pre-filtered by Edge that MFA used, rather than self-filtering data from the overall spreadsheet as ACE did) and does not use a joint SD, which likely explains the difference in power calculations. I think that using a joint SD lowers the variance too much and it is better to look at the variance within both groups, as I did.
[5]: Looking at MFA’s own spreadsheet, it looks like MFA calculated power for each dietary item individually, which is high powered for pork but very low powered for beef (due to the different standard deviations). However, MFA did not include any formulae for how they calculated statistical power, so it is difficult to tell.
A conversation with MFA however told me that they did break it up into individual groups and calculated statistical power using the lowest group sample size from all the groups and highest group standard deviation from all the groups to be conservative.
[6]: The advertisements advertising and incentivizing taking the survey showed no connection to MFA or animals, so it’s very unlikely that people who were predisposed to being vegetarian were more likely to take the survey. Instead, I’d expect the drop-off rate to be random.
As for why the pilot study found a higher response rate than the actual study, it’s hard to say for sure, but I suspect it was because the pilot study was not run for very long, so we inadvertently selected for more enthusiastic people.
[7]: The MFA study didn’t ask about whether people identified as vegetarians, instead just inferring vegetarians based on the meat consumption data, so we cannot confirm this fact in this analysis.
[8]: Sure “talk is cheap”, but how cheap is talk about beliefs when our data on action (e.g., eating less meat) is also based on self-reports? Could it be that talk about belief and talk about action are on equal footing? I’d be inclined to think not. What will matter ultimately is getting people to eat less meat, not to believe things about meat (unless there was some sort of animal welfare legislation on the ballot or something) and it seems pretty easy to believe things about animals while still eating them. So I’m unconvinced how much movement along beliefs really matters, though it could be a subject of further study.
[9]: I was able to replicate Kaufman’s average numbers exactly. This, plus the sample size, was enough to calculate a statistical power of 0.301 using this calculator (and these parameters).
[10]: On a per-serving basis, the experimental group ate 10.44 servings of meat on average and the control group ate 10.04 servings on average. Given our sample size and standard deviations, the smallest effect we could detect (assuming that the experimental group does truly eat fewer servings than the control group) would be the difference between 9 servings and 10.04 servings.
[11]: Facebook does not make it possible to track whether someone has seen but not clicked on ad. It might, however, be possible to try out a different ad network where this could be possible or to make our own. Similarly, maybe we could blanket a particular college with ads and then measure changes in meat consumption at the cafeteria, to see how much a college changes overall compared to control colleges, without having to track down who in particular saw an ad?
[12]: I don’t know whether or not it is statistically appropriate to append one study to another like this. You can keep the methodology, ads, and survey identical to make sure that the data is the same. It’s unlikely that whether or not the study was run in 2015 or 2016 would make enough of a difference to matter and there should be no other relevant differences. Instead, the big problem to me is one of bias -- we’ve already analyzed the results and we’re operating on a motivated continuation where we only continue if we don’t find the effect we’re looking for and only stop once the effect is found. Instead, we need to precommit to a stopping point. But if we can’t combine the two studies like this, spending $192K-$256K to recruit a fresh sample is still well within the current budgets and logistics available, which are much greater than they were when this study was funded.
[13]: Six months to give enough time to run the entire ad campaign without oversaturating the target market (hopefully -- further research is needed to refine this estimate) and three additional months to wait to give the follow-up survey to the last portion of the ad campaign.
I'm not sure about this. Some people that are funding online ads want to reduce animal product consumption now. Others are primarily interested in effecting long-term values shifts, and merely use animal product consumption as a weak proxy for this. I'd be pretty independently interested in answering the question "which intervention is most effective at convincing people that cows, pigs, and chickens are intelligent, emotional individuals with unique personalities?”
If I knew which intervention best did that, and which most reduced animal product consumption, and they were different, I'm not sure which I'd be more excited about funding (but I'd be interested if other people have a strong opinion about this).
Interesting point. I suppose that Peter did pre-emptively respond to it when he noted that "it is still premature to do lots of studies on the relative effectiveness of certain vegetarian messaging ... when we don’t even know if the absolute effectiveness is there yet."
Furthermore, this would probably be really difficult to detect, as ads which aim to reduce animal product consumption now might actually be the most potent vector for effecting long-term value shifts - people who start integrating some vegetarianism into their diets are more likely to come across and even spread information showing the intelligence of factory farmed animals.
Given the problems faced by this study, I doubt we'll have a clear answer to the real long-term effectiveness of various interventions any time soon. The best we can do at the moment is to try a combination of methods that appeal to diverse moral intuitions and interests.
Kudos for this long-term effort and the significant improvements.
Given the problems you're having with statistical power you may do better by creating an index outcome variable that takes several signals into account. For example, the GiveDirectly evaluations combine a variety of well-being measures into a single index to replace massive underpowered multiple testing.
You might want to read this, this and this,
The response rate issue seems key to me: if we had known the study would be substantially underpowered we would probably have not run it, or at least figured out how to run it differently.
What's the right methodology for a response rate pilot?
You're trying to learn what the (cumulative) response rate is as a function of money/time. You need a small enough sample (audience) that you can afford to really probe the dimensions of this space and pull out all the responses you're going to be able to get. So if your full study will have 200k participants, you should have your pilot sample just be ~1k. Then ramp up your spending, and see how many responses you get over time. This tells you the total number of responses you can pull out of a 1k sample, and how much money/time it will probably take to get a given response rate.
(The pilot study in this case didn't actually measure response rate, just response cost, and used CPC ads with a very large sample size in a way that only measured the cost of the first few clicks. Since the first few clicks from a sample are always the cheapest, this wasn't a useful approach.)
Vegan Outreach ran its first annual Leafletting Effectiveness Survey (LES) last fall and we had a dismal response rate as well (around 2%). We were offering $5 incentives for people to take a 2-part survey, where Part 1 was filled out immediately and then an email was sent out two months later to complete Part 2 and claim their gift card. We've been running small response rate studies since then to figure out what kind of incentives we need to hit our targets, but we're seeing significant variation based on what city / state we're operating in. This is making it really difficult to find one incentive level to rule them all.
I wonder if you've looked at the geographical distribution of where your 2% came from? And do you have any theories why your actual response rate differed from your pilot response rate?
I have not. I don't believe we collected geographic data (it's not in the public data set provided), but you could check with Krystal at MFA.
-
It’s hard to say for sure, but I suspect it was because the pilot study was not run for very long, so we inadvertently selected for more enthusiastic people.
This is a very good writeup, thanks for this. Everything strikes me as correct on the merits of the experiment. I think the objection that we don't know how long people watched it misses the mark as you say, since we are interested in the effect of viewing an online ad, not watching an entire video (it can become relevant if we try to extrapolate to contexts where people do watch the entire movie).
As I've said elsewhere, I'm skeptical that the approach to take is to do more such RCTs. I worry about us having to spend extremely large sums of money for such things. Certainly it seems we should compare with other options, like investigations, and not try too hard to find effect sizes that don't dominate those other options.
On this note, what effect size are you using for power calculations? Is it the effect size in the study? You probably want to power it for a smaller effect size - the smallest such effect such that MFA or another org would choose to invest more or less in online ads based on that (so the effect that would determine whether online ads are or are not competitive with investigations and corporate campaigns most likely).
It's probably a good idea to consider the global amount of money being spent on an AR intervention when evaluating the cost to investigate it. Like how much money is being spent across the different AR orgs on FB ads? If a proper study costs $200K and there is only $500K a year being spent globally, then it's hard to see the value proposition. If the total being spent annually is $20M, then a full fledged RCT is probably in order.
Does anyone know of estimates of how much the AR movement as a whole is investing in different interventions? This might help prioritize which interventions to study first and how much to pay for those studies.
I have heard that farm animal welfare as a whole is in the $10m-$100m range, so I would be surprised if something like online ads was $20m a year. That being said, it's worth accounting for long term effects. For example, if online ads were proven not to work for $100k and only $200k gets spent on it a year, the first year might seem like a waste, but if over the next ten years 50% of funding for online ads moves to more effective interventions, this definitely makes it worth it.
Additionally, if something is proven to work, then the amount of total AR funding that goes to it could increase to well past the amount it's getting now. For example, if online ads get strong evidence showing they work, they might get $500k a year instead of $200k and other less proven interventions might get less.
Not to mention that the study itself is delivering the intervention to the treatment group, so the marginal cost of adding the control group for randomization is only a portion of the nominal outlay.
I would be especially wary of conducting more studies if we plan on trying to "prove" or "disprove" the effectiveness of ads with so dubious a tool as null hypothesis significance tests.
Even if in a new study we were to reject the null hypothesis of no effect, this would arguably still be pretty weak evidence in favor of the effectiveness of ads.
What are you worried about here? The same studies will give confidence intervals on effect sizes, which are actionable, and reliable significance at a given sample size indicates an effect of a given magnitude..
Confidence intervals still don't incorporate prior information and so give undue weight to large effects.
Sure, one should attend to priors in interpretation, but that doesn't make the experiment useless.
If a pre-registered experiment reliably gives you a severalfold likelihood ratio, you can repeat it or scale it up and overcome significant prior skepticism (although limited by credence in hidden flaws).
I'm not saying any experiment is necessarily useless, but if MFA is going to spend a bunch of resources on another study they should use methods that won't exaggerate effectiveness.
And it's not only that "one should attend to priors in interpretation" - one should specify priors beforehand and explicitly update conditional on the data.