This post assumes some familiarity with the work of charity evaluator GiveWell, but here's a quick backgrounder for those not familiar: GiveWell lists a small set of top charities to donate to, and publishes detailed reviews of each. The list for 2015 comprises Against Malaria Foundation (malaria bednet distribution), GiveDirectly (unconditional cash transfers), Deworm the World Initiative (deworming), and Schistosomiasis Control Initiative (deworming). GiveWell's recommendations have acquired the status of a gold standard for conventional, unattached donors, and GiveWell has a particularly strong reputation among many of the people who read this site and identify as effective altruists. GiveWell also works closely with Good Ventures, the private foundation of Facebook co-founder Dustin Moskovitz and his wife Cari Tuna. Good Ventures has made significant donations to GiveWell's top charities, mostly at GiveWell's suggestion, with the amount reaching $44.4 million (plus $1 million to standout charities, plus a separate three-year $25 million grant to GiveDirectly) in 2015.
Two days ago, GiveWell published updated (and final) metrics for money moved and web traffic in 2015. The key highlight: they moved almost $40 million from donors outside of Good Ventures. In a December 2015 post, I had made forecasts on GiveWell's non-Good Ventures money moved in 2015. In this post, I'll look at the actual metrics, compare with my predictions, and identify where I was wrong.
Table of contents
- 0. TL;DR
- 1. Analysis
- 1.1. Forecast and comparison with reality
- 1.2. What's with GiveDirectly? And more hypotheses on UHNWIs
- 1.3. Incorrect prediction of overall donor growth, and a deeper dive into discovery, conversion, and retention/upsell
- 1.4. Comparison with 2014 data, and relation with the 2015 Effective Altruism Survey (added July 30, 2016)
- 1.5. Some qualitative predictions of the trajectory for 2016
- 2. Implications
- 3. Updates
0. TL;DR
- GiveWell's estimate of money moved, $39.73 million, falls between the 97.5th percentile and 99th percentile of my distribution for how much money GiveWell would move to its top charities.
- I erred in two big ways: I underestimated the extent to which $1 million+ donations would dominate the landscape, and I underestimated the amount of money that would be moved to GiveDirectly. I believe these errors are related: I think many of the large donations went to GiveDirectly (GiveWell does not release data on individual large donations).
- I also erred somewhat by underestimating the sheer increase in number of donors (though this was not a driving factor behind my underestimation of the total amount of money moved). Relatedly, I overestimated the role of retention/upsell (which was negligible from 2014 to 2015) and (probably) underestimated the role of increased discovery and brand awareness of GiveWell in 2015.
- At a mathematical level, I erred by failing to apply the fact that when adding skewed distributions, the median of the sum can be significantly greater than the sum of the medians. Thus, even though many of my finer predictions were roughly on target, my overall estimation was way off-base. I hope to correct that error when making future predictions.
- In this post, I outline some reasons why GiveDirectly might be a more attractive proposition for ultra high net-worth individuals (UHNWIs) than I had expected.
- I discuss why I believe most metrics will flatline in 2016, but I think there will still be growth because even one or two exceptions to the flatlining trend can drive a decent amount of growth. I expect that the June 2016 recommendation refresh, and the response to it, will yield more insight into how 2016 will shape up.
- I consider implications for potential donors, nonmonetary contributors, and those vetting GiveWell as an organization.
- I time-limited myself while writing the post, so it is not as polished as I might make it with more time.
1. Analysis
1.1. Forecast and comparison with reality
In my forecast, I included a distribution of my estimates for total money moved in 2015, as well as money moved by charity.
Here is the distribution by percentile:
- 1st percentile: $8.8 million
- 2.5th percentile: $11.6 million
- 10th percentile: $14.7 million
- 25th percentile: $16.2 million
- 50th percentile: $18.7 million
- 75th percentile: $24.5 million
- 90th percentile: $28.6 million
- 97.5th percentile: $33.1 million
- 99th percentile: $45 million
Here is the distribution for top charities (50% probability for each):
- Against Malaria Foundation: $8 million - $17 million
- GiveDirectly: $1 million - $4 million
- Schistosomiasis Control Initiative: $1 million - $4 million
- Deworm the World Initiative: $250,000 - $4 million
The actual amount of money moved, $39.73 million, fell somewhere between the 97.5th and 99th percentile in my distribution. Here are the amounts of money moved by charity:
- Against Malaria Foundation: $15.45 million, within my 50% interval, and 56.2% of the Execution Level 1 funding gap identified by GiveWell.
- GiveDirectly: $19.37 million, well outside my 50% interval, and 78.1% of the Execution Level 1 funding gap identified by GiveWell.
- Schistosomiasis Control Initiative: $2.67 million, within my 50% interval, and 54.2% of the Execution Level 1 funding gap identified by GiveWell.
- Deworm the World Initiative: $1.08 million, within my 50% interval, and 33.7% of the Execution Level 2 funding gap identified by GiveWell (GiveWell did not leave any Execution Level 1 funding gap for the organization)
In other words, in three of the four cases, the actual amount of money moved was within the middle 50% of my estimate. But the fourth case was very far off. In fact, if GiveDirectly had stayed at the midpoint of my predicted interval for it, the total money moved would have been safely in my 50% interval. To quite an extent, this and other errors in my estimates boil down to my failing to keep in mind that the sum of the medians is not the median of the sums, and that, in fact, for not-very-tightly-correlated distributions skewed to the right, the median of the sum can be significantly greater than the sum of the medians (basically, if even one of the values is a little bit more to the right of the median, the sum correspondingly becomes higher than the median).
The upshot: I was way off on the whole, but almost the entirety of the explanation for me being way off is related to GiveDirectly attracting significantly more money than I had anticipated. Without that, my estimates would have been moderate underestimates, and Elie Hassenfeld's October estimate of moving a little over $20 million to top charities would have been spot on.
Caveat 1: Note that the percentages of funding gap met are potentially inaccurate since they do not exclude donations made prior to GiveWell's release of its year-end recommendations, whereas the funding gaps identified by GiveWell took into account donations made already. Still, they offer some sort of rough estimate of how much the money moved to organizations compared with GiveWell's identified funding gaps for them.
Caveat 2: Both GiveDirectly and AMF received some money with unknown attribution, and GiveWell estimates that it influenced a total of $7-10 million of these donations (about $5.5 million to AMF and the rest to GiveDirectly). If these additional grants are counted, then money moved to each of AMF and GiveDirectly would exceed $20 million. For simplicity of analysis, I (like GiveWell) ignore this money. I note that making this attribution would make two of the four 50% estimates wrong, arguably making me perfectly calibrated (however, the fact that both cases where I was wrong, I erred on the side of underestimating, signals imperfect calibration). On the other hand, it would push the total money moved to the 99th percentile of my distribution.
I had also made predictions both regarding the number of donors and the amount of money moved per donor:
We see that 2013 was a significant increase year for number of donors, whereas 2014 was an year when the number of donors didn't increase much (there was a lot of churn) but the average money moved per donor increased significantly. I believe that the situation for 2015 will look positive on both fronts: an increase in the number of donors, and an increase in the money moved per donor. My median estimates for the growth on both fronts is around 20%. Explicitly, my 50% interval for the number of donors in 2015 is 9,500-12,500. My 50% interval estimate for the money moved per donor is $1,500-2,000.
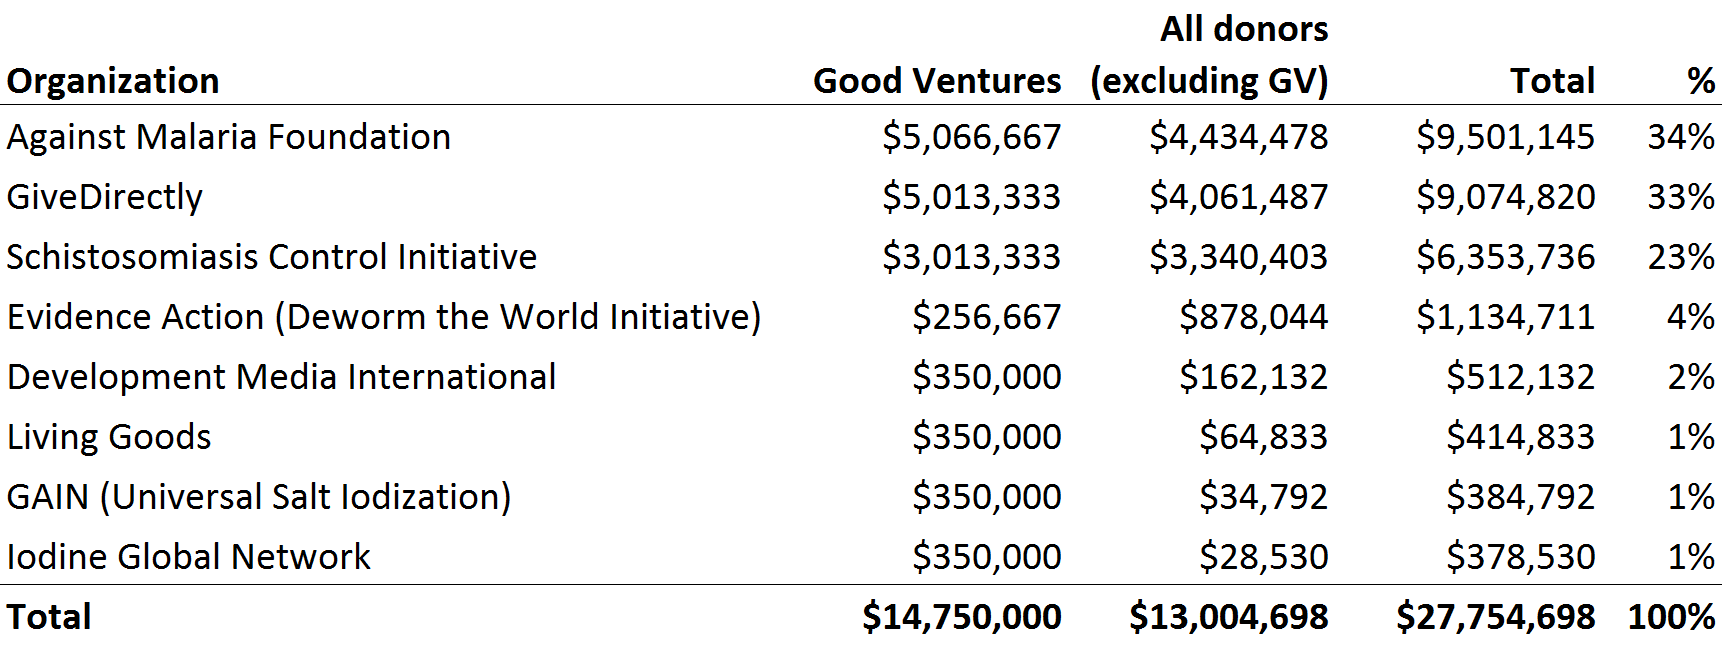
In both cases, the actual value exceeded my 50% interval. The actual number of donors in 2015 was 14,287, and the total money moved was $39.73 million, or a total of about $2,780 per donor. The former estimate was off due to a significant increase in the number of donors at the low end of the range. The latter estimate was off because donations of over a million dollars increased significantly. In fact, 2015 was the first year where over half the total money moved was explained by donations of over a million dollars. Here's the table from the GiveWell blog post.

In fact, if all the people who donated $100,000 or more had donated just $100,000 each, the total amount of money moved would have been at the lower endpoint of my 50% interval.
GiveWell's full metrics report (PDF, 16 pages) contains considerably more detail on their money moved. I'll discuss that more later in this post, but none of those additional metrics were part of my quantitative forecasts.
There are two ways of parsing the severe error in my estimate of money moved:
- I underestimated the popularity of GiveDirectly with individual donors.
- I underestimated the sheer number of people (8 in total) who would donate $1 million or more.
Although GiveWell's report does not break down the charity distribution for $1 million+ donors, I expect that a significant share of the $21.3 million moved from $1 million+ donors went to GiveDirectly. However, I'll explore the two aspects separately first, then combine them and speculate based on that.
The multi-million donors: who could they be?
What does it take to be able to donate over a million dollars in a single year? What kind of net worth or annual income are we talking about? GiveWell doesn't discuss $1 million+ donors in depth, probably to protect their privacy. But we can infer a few things just with arithmetic. We can demarcate two extremes:
- Stable $1 million+/year donors (mostly ultra high net-worth individuals): These are people with over $1 million in annual income (including interest income). For those relying primarily on interest income, this would imply at least $20 million in net worth, or the possession of some rapidly appreciating assets. In other words, stable $1 million+/year donors aren't just millionaires, they are at least one order of magnitude more than millionaires. Moreover, they have at least $1 million to give off in liquid assets. So we're not talking of purely paper millionaires such as early employees at a company like Uber. But we might be talking of venture capitalists, people working in finance, top CEOs, or people who were early employees or investors in a company that has IPO'd and who were able to cash out the stock. Most of these people would probably qualify as ultra high-net worth individuals, the cutoff for which is $30 million in assets excluding one's primary residence.
- One-off $1 million+/year donors (mostly high net-worth but not ultra high net-worth individuals): These are people who are making a one-time donation of that amount. The net worth of people here only needs to be moderately over $1 million for such a donation to be theoretically possible. For people who fall in this category and do not fall in the previous category, they must have either inherited money or been in the workforce long enough to save up enough money, or hit it big with some specific investments (whether as employees vesting shares or by buying financial assets or real estate). These people would qualify as high net-worth individuals but not meet the threshold for being ultra high net-worth (with the exception of people with financial assets that are currently locked down but potentially worth a lot).
Where are these people? One thing I realized is that I know almost none of these people personally, and even the ones in this list I am possibly indirectly acquainted with (friends of friends) I rarely talk to. It also seems like these people do not post regularly on various online fora, whether it's the GiveWell comments section or Facebook groups. On the other hand, it's possible that they do, and just don't let on that they have so much money. Either way, since the total number of such people is pretty small, we can't really draw rigorous statistical conclusions from whether any one of them happens to have been spotted. The point is that most of the methods I used to identify a trend won't work on this population because it is:
- quantitatively small enough to be a rounding error in any kind of statistical compilation (the total number of ultra high net-worth individuals in the whole world is around 100,000),
- outside my friend and acquaintance circle, and
- likely to keep a low profile on public fora.
Thus, my inability to predict an explosion in donations by this group in 2015, amidst various other ambivalent signals (such as flatlining or declining interest in GiveWell on other dimensions) is excusable.
That still doesn't explain why there were so many donors in this group, and why this amount increased significantly in 2015.
1.2. What's with GiveDirectly? And more hypotheses on UHNWIs
A lot of donation money went to GiveDirectly, despite the fact that the charity that GiveWell pushed at year-end was, pretty unambiguously, the Against Malaria Foundation.
- GiveWell explicitly suggested to donors to donate all their money at the margin to the Against Malaria Foundation.
- The 2015 post summarizing staff donations suggested a strong preference for the Against Malaria Foundation relative to other GiveWell-recommended charities. Holden and Elie, the two GiveWell co-founders and co-executive directors, donated 100% to AMF. None of the staff allocated money primarily to GiveDirectly; the ones who did donate to GiveDirectly usually donated 5% or 10%. This was in sharp contrast with the 2013 staff donations post. In 2013, some staff members had allocated all their money to GiveDirectly.
- One of the handful of posts GiveWell published in December 2015 (the peak of giving season) provided suggestions on how to do a fundraiser for AMF. There was no similar post for GiveWell's other top charities. This was also a relatively unusual post coming from GiveWell. They haven't done a similar post for years; the most recent similar posts I could find were from 2010, back when GiveWell recommended VillageReach.
- Giving What We Can, one of the organizations involved in recommending charities (using GiveWell's recommendations as an input) and raising funds for them, does not list GiveDirectly in its top charities. Its 2015 top charities blog post only mentioned GiveDirectly in passing as a potential option for people concerned about long-run room for more funding.
Thus, I expect that a lot of the GiveDirectly-focused donors were not GiveWell regulars. I also suspect, as noted above, that many of these donors were from the $1 million+ group. Part of this is the arithmetic of how donations shook out. The other part is that I'm not aware of any "mass" movement in favor of GiveDirectly, and so the best explanation for how it raised so much money would be if the money came from a small group of people who are somewhat out of the public eye.
So where did these folks come from, and how did they get to donate? I see two possible explanations:
- Demonstration effects: Ultra high net-worth individuals (UHNWIs) are used to sales pitches from people hungry for their money. So, more so than others, they take cues from what other UHNWIs are doing to filter out the range of possible actions. Good Ventures' August 2015 donation of $25 million to GiveDirectly may have had a serious impact on other potential donors. Seeing somebody actually put down that much money legitimizes a donation opportunity. Note that although GV made grants to other GiveWell-recommended charities in 2015, in total GD still received way more money than any other top charity. Moreover, it may take a UHNWI a significant amount of time to decide to donate $1 million+, so the fact that the GD donation occurred in August may have meant ample time to get through the process.
- Greater appeal of the GiveDirectly model to UHNWIs: Perhaps due to its scalability or its novelty, or its conceptual simplicity and robustness to many different assumption sets, and its message of financial empowerment, GiveDirectly may resonate with big-money folks more than topics in global health (a good prima facie set of reasons was articulated by Holden in a 2012 blog post). It wouldn't be surprising if people who have managed to cash in on success more (i.e., their success has been recognized in the form of money) would have a more positive view of financial empowerment and the ability of more money to solve problems. Also, as mentioned above, UHNWIs may be particularly skeptical of weak evidence bases. With limited time to perform evaluation but also a lot more responsibility to spend money wisely (because of the larger sums involved) they may gravitate to interventions that have essentially unlimited room for more funding and are extremely robust with minimal need for complex chains of reasoning. I should note that I have encountered this mindset in a few (non-UHNWI) people, but I don't have direct evidence that UHNWIs are much more prone to this mindset. So there is a bit of speculation here, but it is plausible.
One indicator of the specific interest of UHNWIs in GiveDirectly is found in the GiveWell blog post discussing how it was Good Ventures' insistence that led to the $25 million grant to GiveDirectly:
Our experiences with GiveDirectly over the last few months demonstrate some potential benefits of sometimes being an active funder. In this case, it was only after Good Ventures encouraged us to ask our top charities about how they could use additional large amounts of funding that we had extensive discussions with GiveDirectly about possible growth plans. Our impression is that GiveDirectly’s vision for how it could use additional funds to grow as an organization sharpened over the course of these discussions as it became clear that Good Ventures was interested in making a substantial grant.
Ultimately, these discussions revealed potentially high-impact giving opportunities that we would not have been aware of if we had not pursued the question of how GiveDirectly could use additional funding to accelerate its growth relatively actively. We had previous discussions with GiveDirectly’s leadership where we explicitly asked them a) whether there was anything else we could do to support their growth and b) whether it would potentially be valuable to provide additional funding for their fundraising team. In both cases, GiveDirectly answered that it did not see promising opportunities for additional funding. Our impression is that our persistent encouragement to think more deeply about how it would use significantly more funding, coupled with a strong interest from Good Ventures in providing such funding, motivated GiveDirectly to reflect on its needs and make the funding request detailed in this post. (Likewise, we would not have pursued these conversations with GiveDirectly as actively in the absence of Good Ventures’ persistent encouragement to do so.)
Notably, however, Good Ventures also prompted GiveWell to conduct similar investigations into AMF, so it's not as if they were solely interested in GiveDirectly.
UPDATE: Part of a comment by Catherine Hollander on the GiveWell metrics blog post is roughly in line with what I wrote above. It also emphasizes something I had in my mind when writing the post but neglected to mention: word of mouth from past big donors played an important role. This makes sense: UHNWIs are likely to listen to their friends who are also UHNWIs and have demonstrated their seriousness by previously donating to GiveWell-recommended charities. Even a couple of UHNWIs who had donated in the past can use their network of friends to get their friends interested in GiveWell. As an example, word of mouth from Dustin Moskovitz (whose money funds Good Ventures) could have led a few of the early Facebook employees and investors (who are friends with him) to donate to GiveWell-recommended charities.
That said, for GiveWell’s very largest donors, we believe the increase in donations was due to our long-term approach of building a high-quality research product and reputation rather than any short-term changes to our donor outreach strategy. In almost all cases, the major donors we saw in 2015 had heard about us from another individual who spent a lot of time talking with us over the years, or had heard of us prior to 2015. Our impression is that the increase in major donations in 2015 was a reflection of our long-term approach, rather than a new outreach strategy.
1.3. Incorrect prediction of overall donor growth, and a deeper dive into discovery, conversion, and retention/upsell
The other direction in which my overall model was off was that I failed to predict the overall increase in the number of donors. This isn't explicable in the ways outlined above. The overall number of donors is something that the various statistics I had collected should have been able to inform with reasonable rigor. I think my failure here was mostly just quantitative and not qualitative.
In my earlier post, I identified three challenges for moving money:
- Discovery and brand awareness
- Conversion
- Retention and upsell
I looked at a number of metrics, ranging from Wikipedia pageviews to search interest, and concluded that interest in GiveWell was either flatlining or growing modestly. I didn't see a surge in interest. Also, based on a number of surveys I conducted, I believed that despite increasing brand awareness, most people weren't convinced of the value of donating to GiveWell. I concluded that conversions would therefore rise only modestly. I wasn't broadly off (99%+ of donors remain uninterested in GiveWell, just as they used to be) but my instincts weren't fine-tuned enough to predict just how many exceptions there would be.
Let's take a somewhat closer look at the long-term donor retention figures released by GiveWell in its full metrics report (PDF, 16 pages). On pages 8 and 9, they include three tables on donor retention. Here are the findings in the first table:
- 5,686 donors gave in 2014 and not in 2015, with the amount being about $4.097 million.
- 3,690 donors gave in 2014 and 2015, with the amount donated growing from $11.881 million to $16.057 million.
- 11,584 donors gave in 2015 and not in 2014, with the amount donated being $27.545 million.
I had previously expected most of GiveWell's growth to come from retention and upsell, but the truth was different. For those who donated in 2014, the total amount they donated in 2015 was only a little bit higher than before: an increase from $15.979 million to $16.057 million, or about 5%. Moreover, new donors accounted for well over half the donation amount.
The failure to predict the significant amount of money moved by new donors relates to the failure I documented earlier, namely, a failure to identify big donation amounts and money moved to GiveDirectly. But there were two other errors I made:
- I overpredicted the magnitude of retention and upsell. I had not made an actual numerical estimate, but I believe that had I been asked, I would have predicted more significant growth than 5% from the 2014 donor set.
- I underpredicted the sheer number of new donors, especially the ones at the lowest end of donation amounts (just as I underpredicted donations at the highest end). This was partly based on my inspection of the web metrics. I saw a flatlining of pageviews of GiveWell's Wikipedia page, and concluded that interest in GiveWell from new donors was limited. I expected that to the extent that GiveWell would see growth, it would be from a combination of converting people who had already been interested in the past to finally donate, and upselling past donors to donate more, particularly with the increased importance given to AMF. it is possible that I was right, and that growth stemmed largely from conversion, rather than discovery and upsell. But I suspect that I simply underestimated the role of discovery, and that there may have been some other mysterious factors behind the lack of growth in interest in GiveWell's Wikipedia page (for instance, a less skeptical set of new donors who don't attempt that hard to cross-check organizations across multiple sources).
UPDATE: Catherine Hollander, in a comment on the GiveWell metrics blog post, highlights the role played by media publicity to attracting new, small donors.
We’d guess that substantial media and general attention to GiveWell’s work probably drove the increase we saw in smaller donors. We’ve seen this in past years where we had relatively strong media coverage, and in 2015, GiveWell received a significant amount of coverage, including in new books such as William MacAskill’s Doing Good Better, Peter Singer’s The Most Good You Can Do, and Larissa MacFarquhar’s Strangers Drowning.
1.4. Comparison with 2014 data, and relation with the 2015 Effective Altruism Survey (added July 30, 2016)
On July 29, 2016, Chris Cundy published a post linking to a PDF of the 2015 Effective Altruism Survey Results. This survey covers donation information for 2014, mostly for self-identified effective altruists. The reason the 2015 survey contains 2014 donation data is, as the PDF explains:
We asked about 2014 donations, as the survey started before the end of 2015. Similarly, last year [referring to the 2014 EA Survey Results] we asked about 2013 donations.
I also looked at the actual survey questions to verify that both the questions on donations (amount donated, and charities donated to) explicitly restricted to 2014. The two questions, explicitly, were:
- Over 2014 roughly how much did you donate?
- Over 2014, which charities did you donate to?
The post provides interesting additional information in a few ways:
- It samples from a somewhat different population, namely, mostly self-identified effective altruists and others who have come across the term or idea. With that said, I think that the set of people who took the survey and also donate to GiveWell charities are not that different from typical GiveWell donor.
- It has a number of other questions on people's behavior and priorities (for instance, whether they eat meat, and the relative priorities of various cause areas), that provides more context to their donation choices.
- It includes the actual number of donors to each charity (including GiveWell-recommended charities, and others that have some name recognition in the EA community). This is in contrast to GiveWell's report, which includes the total money moved but not the number of donors by charity. The EA Survey not reporting the total money moved by charity is partly a result of the way the survey was designed: it asked a question about how much money was donated in 2014 in total, and another question about the charities donated to, but did not ask about the amount donated per charity. In particular, for people who donated to more than one charity, the survey data won't be enough to figure out how much went to each charity.
Since the year is off by one, however, we'll need to also pull up the 2014 money moved numbers by charity for GiveWell. Here's the table from the 2014 money moved post:
And for good measure, here is a table from the Wikipedia page of money moved every year to the top charities from donors excluding Good Ventures:
| Organization | Money moved in year 2011[73] | Money moved in year 2012[74] | Money moved in year 2013[75] | Money moved in year 2014[76] | Money moved in 2015[10][77] | Total |
|---|---|---|---|---|---|---|
| Against Malaria Foundation | 1,810,237 | 4,579,514 | 2,490,588 | 4,434,478 | 15,445,609 | 28,760,426 |
| GiveDirectly | 86,146 | 729,359 | 3,482,865 | 4,061,487 | 19,364,385 | 27,724,242 |
| Schistosomiasis Control Initiative | 510,480 | 861,548 | 1,440,184 | 3,340,403 | 2,657,389 | 8,810,004 |
| Deworm the World Initiative | -- | -- | 642,836 | 878,044 | 1,080,068 | 2,601,348 |
As you can see, in 2014, the total money moved to AMF, GiveDirectly, and SCI was all in the same ballpark, whereas DtWI got much less money. A key fact for context around AMF: GiveWell returned AMF to the list of top charities at the end of 2014, after temporarily taking it off the list due to concerns around room for more funding. Therefore, for most of the year, AMF wasn't actually in the top list. That probably explains why it did not raise that much more money than the others.
It is therefore particularly interesting that the number of people in the survey who donated to AMF was about 400, compared to 250 for SCI and 200 for GiveDirectly (see pages 9 and 10 of the survey PDF). How did the charities raise such similar amounts of money, despite the number of donors being so different? It seems that even as far back as 2014, the donation amounts, both as observed in the EA Survey Results and as measured by GiveWell, were heavily skewed in the direction of big donors. My just-so story for this is as follows: most people donate at the end of the year, based on GiveWell's latest research as released at the end of the year. So, most GiveWell donors ended up donating to AMF because it was marked as a top recommendation by GiveWell at year-end. Bigger donors, on the other hand, have longer decision processes. They may conduct additional vetting of charities or engage in discussions with charity representatives. Since AMF was not on the top list for most of the year, they were more evenly distributed between the three charities, leading to an ultimately more even split
Note that this is totally consistent with the fact that in 2015, AMF raised a lot more money than SCI. In 2015, AMF was in the top spot throughout the year, giving bigger donors enough time to select, vet, and arrange money for AMF.
1.5. Some qualitative predictions of the trajectory for 2016
The significant amount of money moved that was influenced by GiveWell recommendations puts GiveWell in new territory. In 2015, GiveWell hit nine-digit levels of money moved ($110.1 million, including the money donated by Good Ventures).
One main downward trend I expect to see for 2016 is a smaller total amount of money granted by Good Ventures to GiveWell top picks:
- The $25 million Good Ventures grant to GiveDirectly (made in August 2015) was a three-year grant, with about $6-9 million of it intended to improve GiveDirectly' fundraising operation. Given GiveDirectly's apparent success at raising more funds, it seems like the grant did its work. I therefore don't expect any similar mid-year grant to GiveDirectly, though I expect that Good Ventures will still make its usual end-of-year grant (on the order of $10 million) to support GiveDirectly's work.
- Similarly, I expect that Good Ventures will continue to make grants of similar magnitudes to those made this year, except to those charities that seem to have had trouble putting to good use the money given so far. And it's quite likely that at least one of AMF, SCI, and DtWI will be deemed to have not yet successfully used funds given so far.
The upshot is that I expect Good Ventures money to GiveWell top picks to not be more than $50 million this year (compared to $44.4 million to top picks excluding standout charities and excluding the one-off $25 million GiveDirectly grant).
If my theory regarding the motivation of UHNWIs is correct, then this dropoff in Good Ventures money pushed is likely to lead to a corresponding drop in UHNWI interest in GiveDirectly. On the other hand, since GiveDirectly's fundraising operations are still scaling up (using the money from Good Ventures) there might be growth on that front. Recently, GiveDirectly launched a $10 million fundraising effort to get matching funds for a long-term study of basic income. Coincidentally or not, there has been a surge of interest in basic income among the intelligentsia of late, particularly in the United States (full disclosure: I personally am not in favor of basic income in general, but GiveDirectly's experiment might be valuable given the small amounts involved). GiveDirectly was therefore able to get some media coverage of its fundraising initiative.
While money raised through these fundraising efforts won't be (for the most part) attributed to GiveWell, it's possible that some people will hear of GiveDirectly through fundraising efforts like this, then subsequently investigate it and chance upon the GiveWell review, and later on donate based on the GiveWell review. This might lead to an apparent increase in the money moved by GiveWell, despite GiveWell not initiating the movement of money but serving more as a vetting and legitimizing mechanism.
Overall, I expect 2016 to largely be a year of stagnation and slowdown in growth. In particular, looking again at the three stages, here are my thoughts for 2016:
- Discovery and brand awareness: I believe that brand awareness of GiveWell will flatline through all of 2016, and potentially fall. I know that this looks like I'm once again underestimating GiveWell's growth prediction, after having done so in 2015. My take is that the significant decline in its Wikipedia pageviews, the paucity of new material published to the GiveWell blog, and the lack of external media coverage of GiveWell in 2016 (something that differentiates it from 2015, when there was a lot of media coverage of GiveWell in the wake of Peter Singer's and William MacAskill's books) will lead to it not being widely discovered. However, events later in the year might change the situation.
- Conversion: I believe that GiveWell will have more difficulty converting people this year than in previous years. Excluding the UHNWI/GiveDirectly phenomenon, I believe its reviews of its top charities will point to less room for more funding, and some charities may even (temporarily) exit the list. I expect new recruits won't really find it that compelling or convincing.
- Retention and upsell: I expect total money moved in 2016 by 2015 donors to grow by less than 5%, and to possibly fall.
Although my median estimate for all three of these aspects is near-zero, I expect to be wrong about at least one of the three, and I expect that, once that error is accounted for, there will be decent growth (somewhere between 10% and 70%) in total donations from the sub-$100,000 and the $100,000-999,999 groups. As noted earlier in the post, one of the errors I made last year was in tacitly equating the sum of the medians with the median of the sums. This time, I'm not doing that. I'm explicitly acknowledging that despite stagnation being the median scenario for each individual case, overall growth is likely to be positive because of the long right tails for each case (i.e., more room on the right than on the left)
Another relevant factor to consider is the change in GiveWell's recommendation refresh frequency from annual to twice a year (June and November). It will be interesting to see if they are able to push that change starting with 2016, and the effect that has on donation patterns.
I will return with more quantitative estimates after more data is available on the donation trends and other metrics of interest for 2016.
Implications
Implications for sophisticated small (sub-$100,000) individual donors
Back when GiveWell's total amount of money moved was small, there were many reasons to donate. Most important was to set a norm in favor of evidence-based donation, and to encourage the growth of GiveWell-recommended charities and the credibility of GiveWell. In particular, doing so made it more likely that charities would actually engage with GiveWell's vetting process, leading to greater scope for finding better places to donate money to. I believe none of these reasons apply with anything like the same force today (unless you're a UHNWI plunking several million dollars).
Therefore, I believe that in order to be convinced to donate to a GiveWell top charity, you should be convinced of both these things:
- The charity is objectively a very good use of marginal funds (setting aside any norm-setting or demonstration effects).
- You either have a very good sense of how much money the charity would raise without you, or the case for marginal donations to the charity is fairly robust across the range of possible values of money moved by the charity. Note that if you believe GiveWell's quantitative estimates of funding gaps, and believe that until a charity meets 100% of its Execution Level 1 funding gap, the case for it doesn't really hit diminishing returns, then 2015 leaves you in good shape: none of the organizations with a nonzero Execution Level 1 funding gap closed it. Even GiveDirectly only got to closing 78% of its funding gap. On the other hand, if you are skeptical of GiveWell's estimated funding gaps, then this skepticism should lead you to rethink whether and how much to donate to GiveWell top picks.
One interesting thing to watch out for is how GiveWell's 2016 reviews relate to its 2015 estimates for funding gaps. For organizations that did not come close to meeting the Execution Level 1 funding gap, were they able to put the money to use effectively? If not, then it is likely that GiveWell overstated the funding gap. If they did, then GiveWell circa 2016 would have vindicated GiveWell circa 2015 (which doesn't necessarily mean it's right, but it at least means that the passage of a year did not reveal a glaring error in the previous estimation exercise).
Implications for people interested in contributing in non-monetary ways
I think there are three potential lessons here:
- Assuming you think money moved to GiveWell top picks is better allocated than counterfactual uses, spending more effort on fundraising for top picks might be worthwhile. However, current fundraising strategies are missing out on much of the money moved. For instance, most (public enough that I'm aware of them) fundraisers focused on AMF, but more money was moved to GiveDirectly. This could also suggest that sophisticated fundraising efforts would require people who have a better understanding of the way UHNWIs operate, and better connections with them. I don't intend to say current fundraising efforts were not cost-effective (they still appear to have raised more money than spent on them) but rather that there appear to be untapped segments and poorly understood donation dynamics that could be leveraged more effectively. It is, however, possible that more secretive efforts to tap UHNWIs have already been successful and were the driving factor for the 2015 increase.
- The increased level of money moved suggests that increased third-party scrutiny of GiveWell top picks, as well as the selection process they used to arrive at those picks, may be more justified than when GiveWell was moving less than 10 million dollars a year. I'd like to see more people take independent, fresh, hard looks at the problems GiveWell is trying to solve. I'm not just talking of re-vetting GiveWell top picks, but of going through a similar process and identifying key points of divergence with them. Personally, I feel like this sort of fresh look is one of the things that has been most conspicuously absent in recent years, and it's something that I hope to encourage more of.
- There is also more of a case for spending significantly more resources on exploring new charity opportunities, both to get a GiveWell recommendation and to potentially compete for what appears to be a larger pool of money that people are willing to spend on evidence-based interventions in global health and global poverty. Charity Entrepreneurship is one of a handful of groups trying to do that. In addition, a case might be made for more funding of efforts like Innovations for Poverty Action or the MIT Poverty Action Lab.
Implications for GiveWell as an organization, and the money it's spending
Prima facie, GiveWell seems to have a huge multiplier. It estimates that $1.1 million was spent in 2015 supporting GiveWell's core operations (the remaining money was spent on the Open Philanthropy Project, which is in the process of becoming a separate organization). The organization moved 100 times that much money. With that huge a multiplier, it seems almost pointless to quibble with whether the specifics of how GiveWell was spending money were efficient in a narrow sense. Even if GiveWell spent four times as much, it would still have an impressive multiplier on money moved.
This does not definitively imply that a donor should at the margin donate to GiveWell. It's not clear that more money in their hands translates to more money moved, or better quality research. Also, GiveWell's revealed preference (with respect to redirecting resources toward the Open Philanthropy Project) suggests that they don't see a lot of room for more spending on core GiveWell operations. Moreover, potential donors to GiveWell's core operations don't have much leverage over GiveWell's work: they don't need your money, since they can always get more from other donors, with Good Ventures a good fallback option.
The upshot is that unless you feel highly aligned with the object level research or outreach being done by GiveWell, it's probably not a good idea to donate with them. But it's also probably not worthwhile to feel concerned about the resources they are spending on their operations since they move considerably more money, and they don't have any short-run plans for significant expansion.
PS: Since I'm time-limiting myself on writing this post, the analysis isn't as thorough as optimally possible. Nonetheless, I hope it is interesting to people.
PS2: GiveWell's full metrics report (PDF, 16 pages) contains many more details, including sources of donors, web traffic, and surveys of donors that reveal information on how GiveWell influenced their decision. I recommend reading it in its entirety. I expect to reference many of these sections in my blog post later this year where I lay out quantitative predictions.
PS3: In response to some feedback I received, I realized that I should clarify that my goal with this post was simply to compare my results against reality, not against alternative forecasts made by others. The only alternative forecast I have available, that was made public, was Elie's board meeting forecast of between $20 million and $30 million in money moved. I had predicted a lower amount of money moved, and explained reasons in my original post, namely, that on the metrics available to me for q3/q4 at the time, which didn't include money moved, year-over-year growth had appeared to have gone down. I won't quote the post all over again, but you can re-read the original post for fuller context. I think those reasons made sense given what I knew at the time, but I should probably have given more credence to a quasi-public estimate being put out by GiveWell, in addition to all the other broader points I made in this post (namely, the effects of dealing with a large number of skewed distributions).
It's important to note, though, that even using Elie's estimate (or a simple extrapolation from year-over-year Q2 2015 growth, the most recent year-over-year growth number available), would have caused a significant underestimation in money moved. Yes, the estimates would have been a little better, and my (wrong in hindsight) reasons for pushing down relative to GiveWell's existing estimates would have been removed. But the fundamental failure to predict the huge amount of money moved by $1 million+ donors, or the large amount of money moved to GiveDirectly, would have persisted.
3. Updates
3.1. High net worth individual outreach
On June 6, GiveWell released audio of its March 21, 2016 board meeting. Near the end of the meeting, GiveWell representatives Holden Karnofsky and Elie Hassenfeld discussed GiveWell's outreach efforts being led by Catherine Hollander and Sean Conley. One of the key areas of focus mentioned was one-on-one followups with all donors who had given $10,000 or more, a recognition by GiveWell of the importance of high-value donors. They mentioned that GiveWell had done this a long time ago but had stopped doing it consistently due to a lack of bandwidth; with the larger employee count, they were able to resume. This is consistent with the March 2016 blog post highlighting why they do donor calls (such posts are usually made only during Giving Season). All of this fits well with the observation made throughout this post of the importance of large donors to shaping both the amount and nature of GiveWell's money moved.
3.2. Predictions for 2016
On November 15, 2016, I entered a number of predictions in PredictionBook about end-of-year charity recommendations, money moved, etc. You can access my entire set of predictions at my user profile page, but the list includes many predictions not directly related to GiveWell money moved. Below, I list the predictions most directly related to the themes of this post.
Predictions on money moved (each prediction initially with 75% probability):
- GiveWell total money moved in 2016 from donors donating less than $100,000 will be between $10 million and $20 million. For comparison, the amount in 2015 was a little under $13 million.
- GiveWell total money moved in 2016 from donors excluding Good Ventures who donate more than $100,000 will be between $10 million and $50 million. For comparison, the amount in 2015 was a little under $27 million (plus money with uncertain attribution).
- The amount of money Good Ventures will donate in 2016 (at end of year) to GiveWell top charities at GiveWell's recommendation will be between $10 million and $50 million.
Another related prediction, not about the amount of money moved, but rather, about timing, was GiveWell will publish a blog post announcing its 2016 end-of-year top charity recommendations before Thursday, November 24, 2016 (Thanksgiving Day). My current probability estimate for this is 70%.
I will edit the probabilities around these predictions as new information comes in, and include comments explaining the updates.
Disclosure: I am not financially affiliated with GiveWell, but have some past and ongoing association with them. You can get a detailed account of my past interaction and affiliation with GiveWell here.
Very interesting post - thanks for writing it!